Exploring Demand Forecasting
As a Data Analyst in the Supply and Marketplace Team, I have the pleasure of answering a broad spectrum of business questions, ranging from the source of user traffic to the backend settings of our inventory. Forecasting customer demand is one of my key responsibilities and will be the focus of today’s post.
Careers Team
.avif)
Key takeaways:
Marco Venè, Data Analyst, tackles many different tasks in support of the Supply and Marketplace teams. One of his key responsibilities is forecasting demand. In today’s post, he walks us through all that demand forecasting entails and how the insights he gathers help the Supply and Marketplace teams perform at their best.
{{divider}}
Introduction
As a Data Analyst in the Supply and Marketplace Team, I have the pleasure of answering a broad spectrum of business questions, ranging from the source of user traffic to the backend settings of our inventory. Forecasting customer demand is one of my key responsibilities and will be the focus of today’s post.
Working on forecasting customer demand has been incredibly rewarding because of the interesting data challenges and the high impact it has on sales and supply execution planning. It was gratifying to work on this topic because it involved all the steps of a full data analysis workflow from business understanding, through data manipulation and machine learning, to final recommendations. I’m glad I was able to produce accurate automated predictions and that I learned so much during the process.
What and why?
Before diving into the data, let’s first explain what we mean by demand forecasting and why we do it. At GetYourGuide, forecasting demand means predicting potential future ticket sales based on our customer demand. Our forecasts are produced on a single-activity level with the option to aggregate several forecasts together in a typical bottom-up approach.
The predictions help the Sales and Connectivity teams allocate resources and define the supply execution strategy. For example, we use demand forecasts to prioritize the sales acquisition targets and to select the suppliers with whom we should develop direct connections to improve availability management. If you are interested in understanding more about the Connectivity team and their tech challenges, I recommend you check out this post from our Connectivity Engineer, Malachi.
Choosing the right metric to forecast
The initial, and most, crucial step of forecasting is defining the metric used to predict. Forecasting the demand of future ticket sales is not an easy task. Demand is an elusive concept that depends on several hard-to-measure factors like market development, brand awareness, and competition. That said, we do have some measurable predictors such as site traffic and past sales, and we can also feature engineer other variables to help with forecasting.
The first predictor of future ticket demand is straightforward: Tickets Sold. Past sales have the predictive power to estimate future demand because past sales capture past demand quite well. In a world where we could convert every customer with a serious intention to book something on GetYourGuide, Tickets Sold would almost be enough as a predictor.
The problem with using Tickets Sold as a sole predictor is that actual ticket availability is a serious challenge within the travel activities business, and often demand cannot be fulfilled due to a lack of last-minute tickets. Hence, in order to estimate past demand, it is a good idea to compute how many tickets we could have sold if we had full availability. We call this metric Missed Opportunity. Developing this variable was not a trivial task and could be a separate blog topic in itself.
By adding Missed Opportunity to Tickets Sold, we have a complete picture of the past demand, which we can use to train our forecasting algorithm. The new variable captures the traffic pattern and the ability of GetYourGuide to convert that traffic in the case of full availability.
Below is a picture of what a daily time series of Tickets Sold and Tickets Sold + Missed Opportunity may look like for an activity; the points and transparent lines represent daily value and the bold lines are weekly moving averages. You can notice a strong seasonality pattern, with the sales and the missed sales opportunity increasing and decreasing periodically.
.avif)
The Forecasting Algorithm
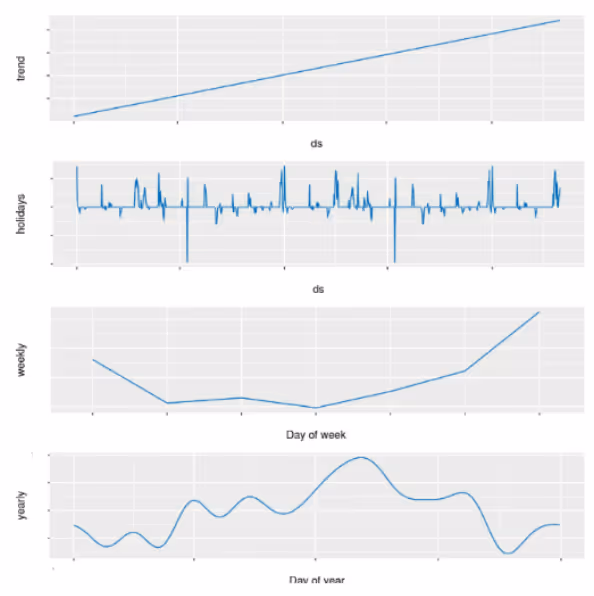
In our database, we create a table reporting the historical values of the Tickets Sold + Missed Opportunity metric for every activity we want to forecast. This serves as the training set for our forecast algorithm. With the training data, we can model the time series and produce our forecasts. At GetYourGuide, we use the Prophet forecasting algorithm, which was released by Facebook in 2017. While the details of the model are out of scope, the algorithm is essentially an additive regression model composed of the following elements:
- Trend
- User-inputted seasonality components modeled with Fourier series (daily, weekly, monthly, yearly)
- Holidays
- Other additional user-provided regressor
When we started the project, we tried other methods like ARIMA and ETS, but Prophet outperformed the other methods, was easy to use, and was scalable. An important parameter of Prophet is growth, which models the trend either as piecewise linear or as a logistic growth curve. When using the piecewise linear setting, Prophet has a powerful automatic process to detect changes in trends, but, at times, this method can also lead to overfitting the train set. On the contrary, the logistic growth has no change-points and, hence, tends to have less risk of overfitting.
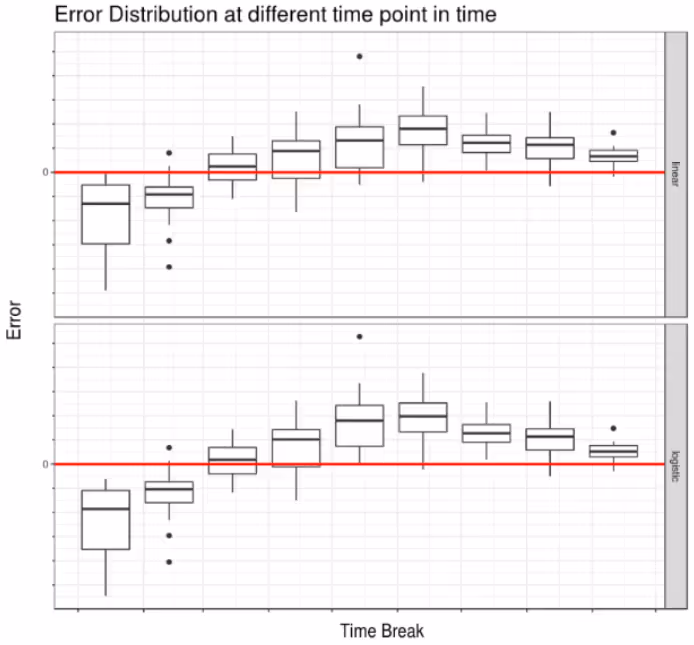
At GetYourGuide, we use the cross-validation for time series method to select which parameter to use for our forecasts. This method produces several forecasts using first an initial portion of a training set and then expanding that set at each forecast iteration. By producing forecasts with a subset of the full training set, we can compute the forecast error on the validation data. Below is a typical plot I look at when choosing if a linear or logistic parameter fits the data best. The box plots represent the distribution of the error on the forecasted set at each forecast iteration for the linear and logistic parameter. In this example, we can see how the model performs similarly in the two cases, making the choice less relevant. In the plot, we can also observe how the forecast improves by expanding the training set available, passing by significant under-forecasts in the first iterations to less-significant over-forecasts in the last iterations. However, the tendency to over-forecast is still strong in this case, hence the model can be improved. The general goal here is to have the errors close and centered at 0.
Including Holidays
When forecasting the demand for travel activities, holidays are, of course, crucial. Demand has strong spikes around international holidays such as Easter and New Years Eve. Regional holidays such as German Unity Day can also have a drastic impact on demand. Therefore, we include all national holidays for our top source and destination markets as dummy predictors. The impact of each holiday on ticket demand depends a lot on the relevancy of each holiday to the different products. For instance, German Unity Day will affect ticket sales for the Berlin TV Tower more than it will affect the sales of a guided tour at the Sydney Opera House. To model this interaction we include a prior scale to the holidays dependent on the importance of the source market for a destination; this smooths the effect for less relevant holidays and avoids overfitting problems. Below is a sample output of the Prophet model with trend, holidays, and weekly and yearly seasonality components.
Generating the forecasts
Once the model is ready and the cross validated outcome is satisfying, we produce and store the forecast of the daily future ticket demand for each activity and the confidence interval in the database. This triggers the update of a dedicated forecasting report in Looker used by the Sales and Connectivity Team to plan their execution. Below is a sample of how the data for an activity would look in the report.
.avif)
Wrap-Up
As I mentioned previously, working on this project has been incredibly worthwhile because of both its technical challenges and the impact it has had on the teams. I learned a lot and look forward to what more I can learn working on this topic in the future.
Thank you, Marco, for your insight. Interested in working alongside Marco on challenges like these? Check out our open positions on the Data team.

More articles like this