How We Built our New Modern ETL Pipeline, Part 2
As we discuss this layer, we also highlight how a design that focuses on optimizing transformation execution order helped us dramatically decrease overall processing times, improve recovery times, and enhance the reliability of our systems through improved testability. But before turning our attention to the solution, let’s take a closer look at the problems that we were trying to address.

Engineering Manager
%2520(2).avif)
Key takeaways:
In the first of this two-part series, Thiago Rigo, senior data engineer, gave an overview of some of the challenges that our Data Platform team faced with its legacy ETL pipelines and introduced the first of the system’s two main parts: The extraction layer. In this follow-up post, David Mariassy, data engineer, focuses on the transformation layer of our new ETL solution.
As we discuss this layer, we also highlight how a design that focuses on optimizing transformation execution order helped us dramatically decrease overall processing times, improve recovery times, and enhance the reliability of our systems through improved testability. But before turning our attention to the solution, let’s take a closer look at the problems that we were trying to address.
{{divider}}
The performance bottleneck: Sequential execution
Before we begin, let’s clarify the meaning of a couple of key terms that we use throughout this article:
- Transformation: A job that takes some input data, applies business logic on it, and writes the results to a data warehouse (DWH) table. I use the words task and transformation in this article interchangeably to refer to the same concept.
- Transformation Dependency Graph (TDG): A graph determining the order in which a set of Transformations is executed.
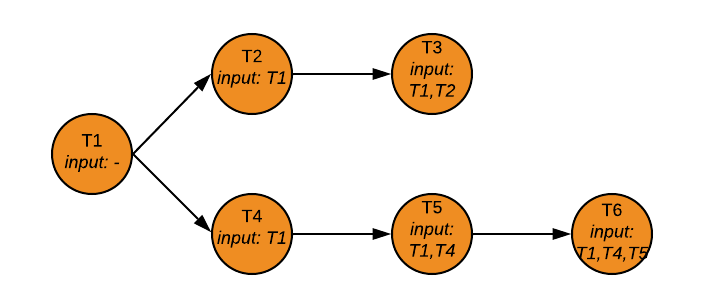
The dependency graph above depicts the optimal execution order of the six transformations that constitute this pipeline. The transformations are only blocked by those upstream processes that generate datasets which they consume. The two branches - T2+T3 and T4+T5+T6 - can proceed in parallel, which means that all unnecessary latency is eliminated.
For our team, however, the reality looked pretty different at the beginning of 2019. The graph below provides a much more accurate representation of the status quo at that time.

As this dependency graph illustrates, we were running a pretty inefficient pipeline where transformations were blocked by other tasks that did not contribute to meeting their data dependencies. T4, T5, and T6 were all unnecessarily delayed in this TDG by T2. Similarly, T3’s landing time was also negatively affected as it was blocked by T4, T5, and T6.
You might also be in interested in: Taming data science: discovering best practices
Besides overall landing times, the problems associated with suboptimal dependency graphs can be compounded if critical tasks get moved to the end of the pipeline. Even when things go right and, nothing breaks, this makes a critical table available to users and consumers much later than what is theoretically possible.
Trying to manually define an optimal dependency graph with this many nodes is virtually impossible. That’s why we decided to build Rivulus and let it manage dependencies for us.
But the situation is even worse when things go wrong, and the critical transformation fails. When this happens, the inefficient dependency graph delays detection and alerting, and therefore significantly prolongs the recovery process.
So why did we, and presumably, many other data teams in the tech world, end up with a suboptimal dependency graph? Arguably, these situations wouldn’t arise if teams only had to manage six transformations. But the reality is usually pretty different –– for example, at the time of writing this article, GetYourGuide is running over 170 transformations in its DWH pipeline.
Trying to manually define an optimal dependency graph with this many nodes is virtually impossible. That’s why we decided to build Rivulus and let it manage dependencies for us.
Rivulus
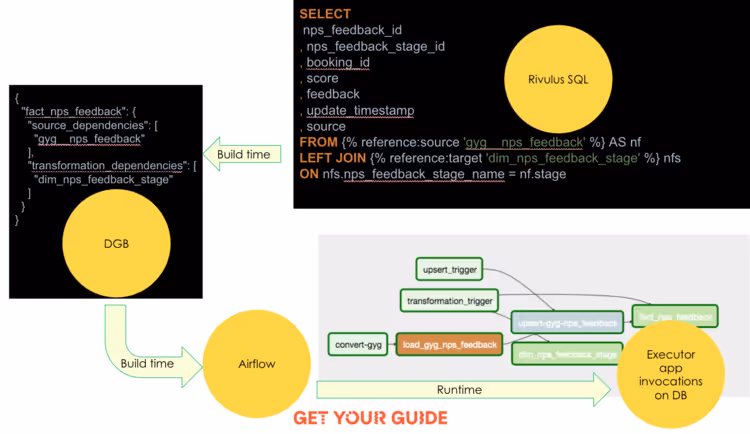
Rivulus means stream or brook in Latin and is the name we gave to our pipeline’s transformation layer. The layer comprises of four main components:
SQL Transformations
A collection of SQL files. Each file defines a single transformation expressed as a SELECT statement using our custom-built Rivulus SQL. Rivulus SQL is a slightly modified version of Spark SQL that uses template variables to denote source tables instead of referencing them directly. So for example, SELECT * FROM dim_tour would become SELECT * FROM {% reference:target “dim_tour” %} in Rivulus SQL. “Target” in this context indicates that the task depends on data produced by an upstream transformation.
These references need to be distinguished from “source” - e.g. {% reference:source “tour_history” %} –– dependencies that represent a relationship between a transformation and a source table. Such dependencies indicate that the source table needs to be loaded to the data lake during the extraction phase of our pipeline, as described in Part 1 of this series.
Executor App
A Spark application that executes a single transformation after translating the Rivulus SQL statement to standard Spark SQL.
Dependency Graph Builder (DGB)
A Scala application that traverses all SQL Transformations within a directory and generates a JSON document that encodes the dependencies between the transformations by parsing the special syntax elements of the Rivulus SQL statements.
Airflow
We use Airflow to orchestrate the execution of the transformations in the order defined by the DGB. The DGB’s output JSON is supplied to Airflow in the form of an Airflow Variable, from which a DAG is created dynamically. During runtime, Airflow submits one Executor App job per transformation to ephemeral Spark clusters.
You might also be interested in the article: Exploring demand forecasting
Putting it all together
Testability
Data sharing across transformations is a fact of life for data engineers. Testing a newly developed or updated transformation, therefore, requires ensuring that consumers of its output data will continue to function as expected after the change is released. In an excessively sequential graph, this requires re-running a lot more transformations than what would be strictly necessary.
To re-use the example from above, imagine a scenario where a new version of T2 had to be tested. Since a sequential graph would obscure the true data sharing dependencies between the transformations, T2+T4+T5+T6+T3 would have to be executed as part of an integration test suite. With Rivulus, we can be sure that testing T2 and T3 is sufficient since we have aligned the transformation graph with true data sharing dependencies. This makes testing a lot quicker and simpler.
You might also be interested in the article: Using advanced liquid templates to optimize query performance.
Conclusion
In this two-part series Thiago Rigo and myself, David Mariassy, have tried to give an overview of GetYourGuide’s new ETL pipeline. Through the combination of a new approach to data extraction –– using change data capture methods and incremental processing (part 1) - and efforts to optimize our transformation dependency graph (part 2), we have successfully modernized our core DWH pipeline.
As a result, users of our Data Platform can access fresh and timely data throughout the day. We will continue to scale and improve these systems as the needs of our users evolve, and we’ll make sure to keep you posted about our progress here.

More articles like this