Boosting App Performance with Baseline Profile at GetYourGuide
Discover how GetYourGuide boosted app performance by over 20% using Baseline Profile technology. This blog post delves into the successful integration of Baseline Profiles to enhance app startup times and runtime performance, significantly reducing frozen frames and improving user experience. Learn about the technical strategies employed, such as ahead-of-time compilation and optimized dex files, and how these were implemented without the need for extensive code refactoring.

Key takeaways:
GetYourGuide has successfully enhanced app startup time by over 20% and runtime performance by more than 25% through the integration of Baseline Profile. This initiative began after identifying a high percentage of frozen frames adversely affecting user experiences. By leveraging the Baseline Profile, we achieved significant performance improvements without needing code refactoring, which provided strong motivation for its adoption in our project.
{{divider}}
Understanding Baseline Profile
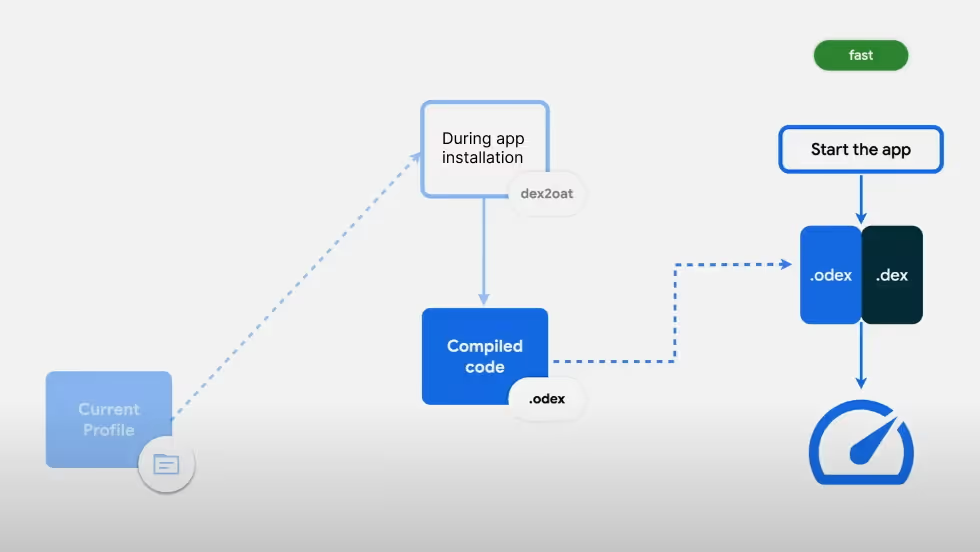
Baseline Profile provides a list of methods and classes that are compiled ahead of time and downloaded while installing the app.

When the app is installed, the dex2oat compiler converts these profiles into optimized dex files (odex). Upon app startup, both the odex and the original dex files are available, optimizing the critical parts of the app and enhancing performance.
Note: If you don't use the baseline profile, you can still benefit from Odex, although it will take longer. You can benefit from using cloud profiles from Android 9.0, from Android 7.0 using JIT + Profile Guided Optimization, or from Android 5.0 with full AOT. However, each method has its drawbacks. I won't cover them here, so please check out the video from Google for more information - Making apps blazing fast with Baseline Profiles.
Implementation Strategy
Implementing the baseline profile in our large codebase was challenging because it needed to be adjusted to our existing setup. Initially, we introduced the baseline profile to only analyze the first user flow until the first frame. This resulted in a 20% improvement in app startup time. Later, we added the baseline profile plugin and included crucial critical user journeys. We had to take it step by step because specific internal dependencies were causing cyclic dependency errors, and we had to fix them gradually over time. We covered the critical user journey from app startup to booking the activity flow, which is essential for our customers.
We divided the journeys into three baseline profile generators: the onboarding flow, home scroll, and booking flow. This division ensures that each flow's execution is consistent, even when tests are repeated 15 times.
To streamline the process, we incorporated the generation of Baseline Profiles into our GitHub Actions workflow. This automation eliminates manual updates, particularly during inconvenient times like Friday nights.
Automation Details
Our GitHub Action runs each time changes are merged into the main branch. It generates the Baseline Profile using Firebase Test Lab and Flank, retrieves the prof file, and places it into /getyourguide/src/productionRelease/generated/baselineProfiles/ directory. Subsequently, a release APK is generated, which automatically picks up the baseline profile file.
We had a problem with the main branch's CI failing due to a broken baseline profile flow. We've addressed this by adding a new CI check to the PR checks specific to the baseline profile flow, which should only take a maximum of 10 minutes. The baseline profile generation time during PR checks is much faster than on the main branch because the PR checks only run each flow iteration once for validation, compared to the main branch, where up to 15 iterations of each flow are required. We don’t have any more failing baseline profiles on the main branch.
Results and Impact
By applying Baseline Profiles, GetYourGuide improved slow cold startup by over 20%, from 1.90% to 1.49%, as provided by Android Vitals. Runtime performance was boosted by 25%, as observed in macro benchmarking. A notable enhancement was observed on the Date Picker screen, where the percentage of frozen frames decreased by 60%.
To better illustrate the benefits, I included a comparison of JIT Thread Pool snapshots of our date picker scrolling from system traces under CompilationMode.None and CompilationMode.Partial
CompilationMode.None

This is a JIT activity thread that shows the colored bars representing the tasks being executed, i.e., the Just-in-Time compiler compiling the interpreted code.
CompilationMode.Partial

If you notice, the colored bars are reduced in partial compilation mode.
Reasoning:
In CompilationMode.Partial, the JIT Thread Pool is less dense, indicating reduced workload due to precompilation of essential code, significantly enhancing performance.
Conclusion
The baseline profile showed significant performance improvement in constantly improving the customer experience.
Special thanks to Ben Weiss, Himanshu Singh, Anmol Verma, Milan Jovic, Benedict Pregler, and Volodymyr Machekhin for assisting and reviewing the draft.


.JPG)
