Debugging JVM OutOfMemoryErrors: A Step-by-Step Guide
Discover effective strategies for debugging JVM OutOfMemoryErrors with our comprehensive step-by-step guide. Learn to identify common causes such as heap space exhaustion, memory leaks, and excessive object retention. Master techniques for monitoring application logs, analyzing JVM metrics, and performing heap dump analysis. Optimize your JVM configuration and leverage tools like VisualVM and Eclipse MAT for memory analysis. Enhance your application's stability by implementing proactive memory profiling with Datadog. Prevent future issues and minimize downtime by understanding JVM memory usage patterns and optimizing garbage collection settings.

Senior Software Engineer

Key takeaways:
Understanding JVM OutOfMemoryErrors
In Java, encountering a java.lang.OutOfMemoryError signals a critical issue where the Java Virtual Machine (JVM) is unable to allocate sufficient memory for object creation. This error can arise from various underlying causes, each requiring specific debugging and optimization strategies.
Common Causes of java.lang.OutOfMemoryError
- Heap Space Exhaustion
- Memory Leaks: These occur when objects are no longer needed but are still referenced, preventing garbage collection from reclaiming the memory.
- Excessive Object Retention: If objects remain in memory longer than necessary (for instance, through long-lived references), it can lead to excessive memory consumption, eventually filling up the heap.
- Garbage Collection (GC) Inability to Reclaim Memory
- The JVM relies on garbage collection to automatically manage memory. However, inefficient garbage collection can lead to fragmentation or failure to reclaim unused memory.
- Insufficient Memory Allocation
- In some cases, the JVM might be restricted by the available physical memory or container resource limits (e.g., in Kubernetes). This can lead to an OutOfMemoryError. Even if the heap space is not entirely exhausted, it cannot grow further due to external constraints.
Identifying OOM Errors
Before diving into debugging, it’s crucial to recognize the OOM errors by analyzing the symptoms.
What we saw in our service:
We had degraded pods—4 out of 6—where all endpoints returned Internal Server Error, causing latency spikes. When we checked our metrics, we saw CPU and memory spikes for the application and timeouts from the database—basically, everything was broken. This led to some confusion about the actual nature of the issue.
Our application is read-heavy, which means we fetch a lot of data into it, have complex business logic, and return huge lists of entities.
We followed the below approach of checking logs and metrics :
Step 1: Monitor application logs
- Objective: Detect OOM errors and identify their root causes.
- Actions:
- Review application logs for error messages such as java.lang.OutOfMemoryError.
- Identify additional details indicating the type of memory issue (Heap Space, Metaspace, or Native Memory).
- Check timestamps and patterns to correlate with system behavior.
Step 2: Track and analyze JVM metrics
- Objective: Understand memory consumption trends and detect early signs of memory pressure.
- Actions:
- Monitor JVM heap usage against maximum heap allocation.
- Track key JVM metrics such as:
- Used vs. Maximum Heap Memory: Ensure heap usage remains within a healthy threshold.
- Garbage Collection (GC) Activity: Identify frequent or prolonged GC pauses.
- Thread and Metaspace Usage: Detect potential memory leaks.
- Set up alerts if heap usage consistently exceeds 80%.
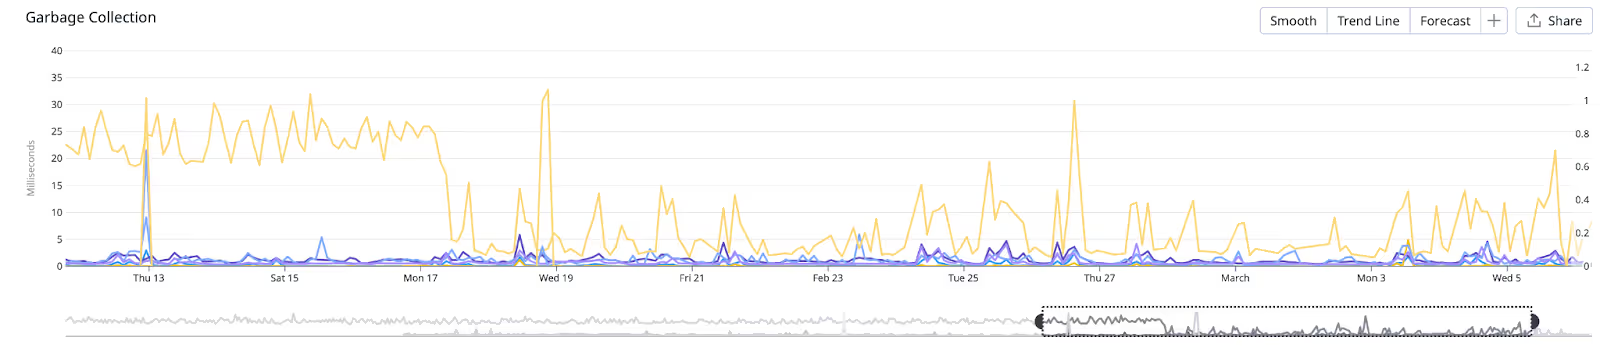
- Metrics to watch for old and young generation:
- jvm.gc.major_collection_time
- jvm.gc.minor_collection_time
GC collection time greater than 10ms is worrying, whereas our collection time was constantly greater than 30 ms with spikes of 1s.
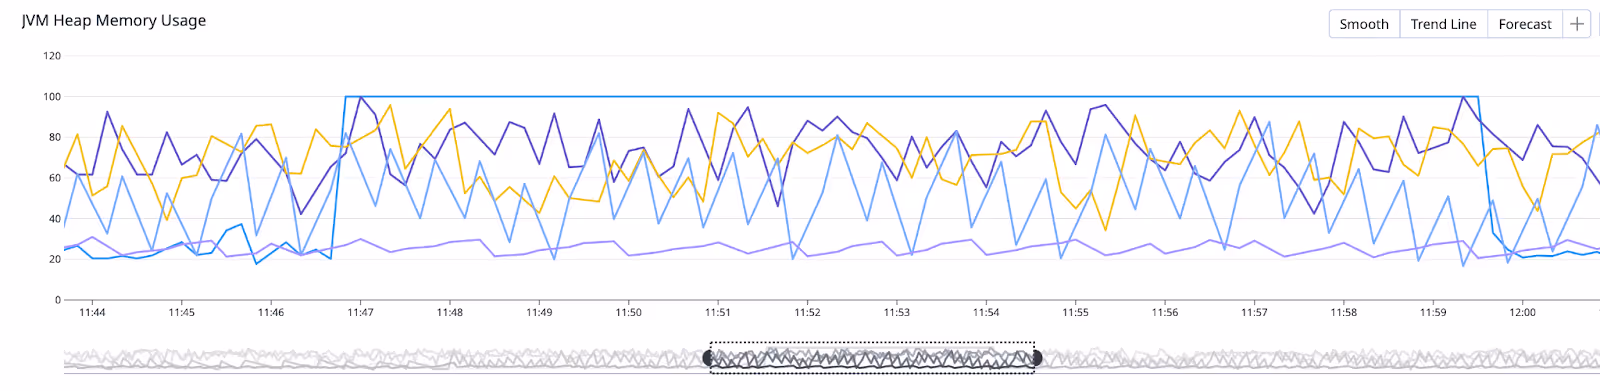
Step 3: Identify memory pressure patterns
- Objective: Detect trends that lead to OOM errors.
- Actions:
- Observe if memory usage remains consistently high (>60%).
- Identify spikes leading up to 100% usage.
- Correlate OOM events with traffic patterns, application deployments, or specific workloads.
Step 4: Perform heap dump analysis (if required)
- Objective: Pinpoint objects responsible for excessive memory usage.
- Actions:
- Capture heap dumps when memory usage is high.
- Analyze heap dumps using tools like Eclipse MAT or VisualVM.
- Look for memory leaks or large object retention.
Step 5: Optimize JVM configuration
- Objective: Adjust JVM settings to improve memory management.
- Actions:
- Fine-tune heap size allocation (e.g., -Xms, -Xmx).
- Adjust Garbage Collector settings (e.g., G1GC, MaxGCPauseMillis).
- Limit metaspace growth if excessive.
Step 6: Validate fixes and monitor stability
- Objective: Ensure applied changes effectively mitigate OOM errors.
- Actions:
- Deploy fixes in a controlled environment.
- Monitor JVM metrics and logs for improvement.
- Compare memory trends before and after changes.
- Ensure application stability under normal and peak load conditions.
Successful Degradation on OOM
In production, it is crucial to gracefully handle OOM errors and restart affected services automatically. Using the exitOnOutOfMemoryError JVM parameter ensures that the application exits cleanly when an OOM error occurs, allowing Kubernetes or other orchestration tools to restart it.
Enabling automatic exit on OOM
Add the following JVM option:
This ensures that when an OOM error occurs, the JVM exits immediately, reducing the chance of a degraded state where the application is unresponsive but not completely crashed.
Enabling Heap Dumps on OOM
Heap dumps are snapshots of the JVM memory at a given time and are essential for analyzing OOM errors.
JVM options
Modify the JVM startup arguments to automatically generate heap dumps on OOM:
The first option enables heap dump creation before the JVM exits, while the second specifies the location where the heap dump file should be stored.
Using ephemeral volumes and a sidecar container in Kubernetes
For Kubernetes environments, heap dumps should be collected and uploaded to an external storage location (e.g., Amazon S3). You can achieve this by:
1. Adding an Ephemeral Volume and Bucket in the Kubernetes Pod
2. Adding a Sidecar Container to Run the Above Script
This setup ensures that heap dumps are automatically stored in an ephemeral volume and uploaded to an S3 bucket using a sidecar container.
Analyzing the Heap Dump
Once a heap dump has been collected, memory analysis tools can be used to investigate the root cause.
Recommended Analysis Tools
- VisualVM (https://visualvm.github.io/download.html) – Highly descriptive and user-friendly for finding large objects.
- Eclipse Memory Analyzer Tool (MAT)
- JProfiler
Steps for Analysis
- Load the heap dump file into the analysis tool.
- Navigate to the object views to analyze memory usage by class.
- Select dominators instead of all objects to identify the largest objects and retained heap size.
- Once the retained size is computed (may take 10-15 minutes), inspect large objects such as HashMap or ArrayList instances.
- Drill down into the object tree to find the exact source of excessive memory consumption.

What If OOM Doesn't Happen, But JVM Usage Spikes Irregularly?
Sometimes, your application may experience unexplained JVM memory usage spikes without encountering an OOM error. These irregular memory surges can lead to performance degradation, increased GC activity, and unpredictable behavior. In such cases, monitoring tools like Datadog can help proactively detect memory inefficiencies before they become critical issues.
Key reasons for irregular JVM memory spikes:
- Temporary Large Objects: Large collections or buffers are used temporarily but cause short-term high memory usage.
- GC Pressure: If the JVM struggles to free memory quickly enough, it may cause intermittent spikes in heap utilization.
To diagnose and address these issues, real-time memory profiling is necessary.
Proactive Memory Monitoring with Datadog Memory Profiling
Rather than waiting for OOM errors to occur, proactive memory profiling helps detect and resolve issues early. Datadog provides real-time memory profiling to analyze JVM memory usage efficiently. This allows you to:
- Identify memory-hungry methods and objects.
- Track memory allocation per class and method over time.
- Compare memory trends before and after optimizations.
Enabling Datadog memory profiling
To enable memory profiling in Datadog for Java applications, check the integration docs.
This helps correlate memory usage with specific code paths, making debugging and optimization much easier.

NOTE: Enabling memory profiling adds an extra 10-20% memory usage and the added monetary cost of using the feature on your application, so only enable it for debugging purposes.
Conclusion
To effectively debug JVM OutOfMemoryError (OOM) issues, take a proactive, structured approach:
- Monitor logs and system metrics to detect memory bottlenecks.
- Analyze heap dumps and memory snapshots to identify leaks or inefficient object retention.
- Optimize by tuning garbage collection settings and fixing memory leaks.
- Prevent future issues with continuous profiling — use tools like Datadog for real-time memory insights.
Implementing these actions helps to enhance application stability, reduce downtime, and prevent costly failures.

More articles like this