From Snowflake to Databricks: Our cost-effective journey to a unified data warehouse
Discover how GetYourGuide successfully migrated its data infrastructure from Snowflake to Databricks, achieving a 20% reduction in operational costs. In our latest blog post, explore the engineering journey of unifying our data warehouse, enhancing business intelligence capabilities, and optimizing SQL queries. Learn about the step-by-step process of conducting a proof-of-concept, implementing an incremental rollout plan, and overcoming challenges in SQL syntax adjustments. Gain insights into the benefits of centralizing data processing, improving query performance, and leveraging Databricks features for a streamlined and cost-effective data environment.

Senior Data Engineer

Key takeaways:
At GetYourGuide, we rely heavily on data to understand our customers and suppliers better. Therefore, we use Looker continuously for our Business Intelligence analysis. Recently, we migrated our Looker data source from Snowflake to Databricks to centralize our data warehouse and reduce operational costs. This migration led to a 20% reduction in costs and simplified our data infrastructure. Robert Bemmann and Houkun Zhu from our team share their insights and experiences from this significant transition.
In this article, we delve into the key reasons for the migration, the strategic approach adopted for the proof-of-concept (PoC), and the successful outcomes achieved.
{{divider}}
Motivation and scope of migration
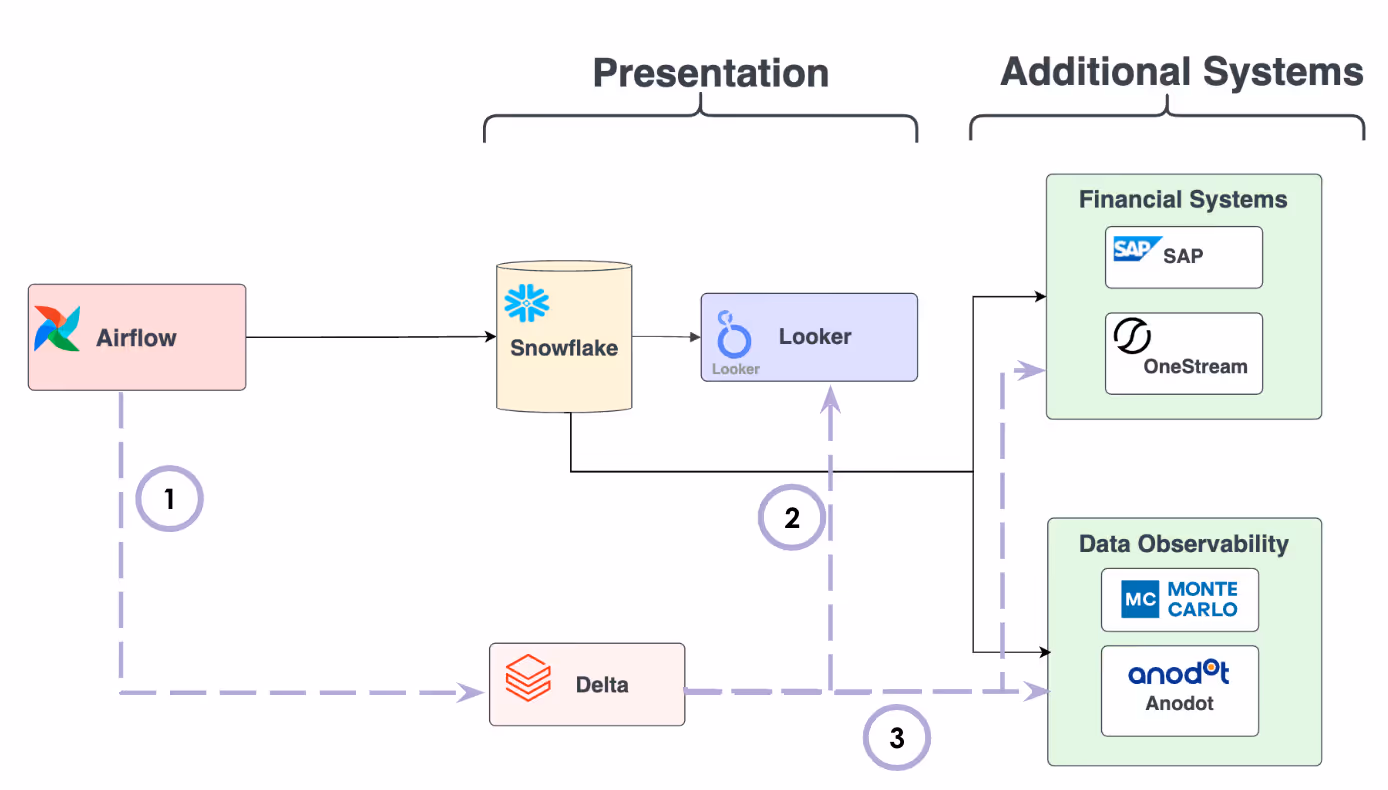
GetYourGuide’s Data Environment
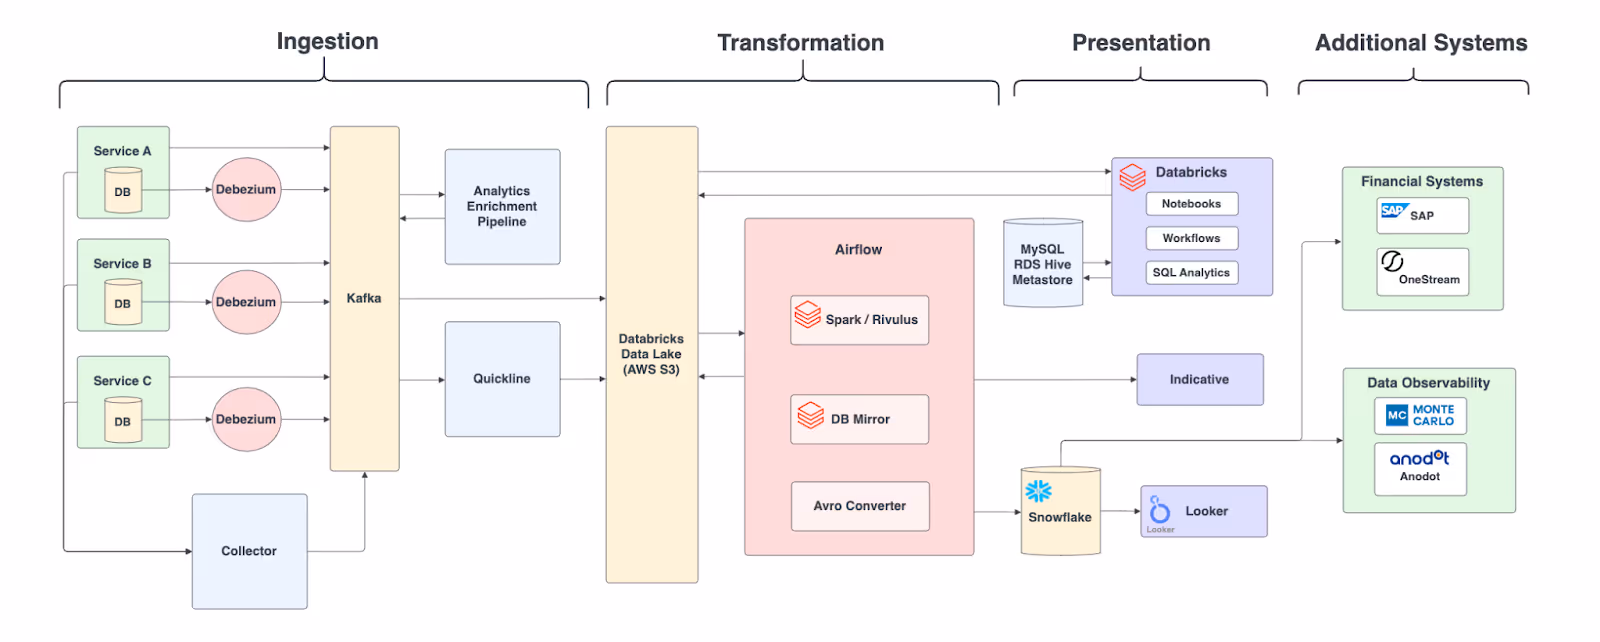
To understand our migration process, here’s a quick overview of the key components of our data environment:
- Ingestion of data
- Change data capture (CDC) of our RDS production databases via Debezium and Kafka
- Collection of an avg. 300M+ analytical events (clickstream and more) via HTTP API (using Apache Pekko), enrichment via Kafka Streams, and eventually dumped to S3 as a permanent sink
- Transformation Layer
- The vast majority of our transformations happen with Apache Spark (Scala, Python, SQL) on Databricks, scheduled via Apache Airflow
- Our Data Lakehouse consists of S3 as a storage component and a MySQL RDS instance as an External Hive Metastore
- Presentation Layer
- Looker is the self-service business intelligence tool to build and explore business reports and dashboards with Snowflake as a cloud data warehouse and query engine
- Software Engineers, Data Analysts, Data Scientists, and Machine Learning engineers query our datasets or create data pipelines via Databricks notebooks and SQL Analytics
- Additional Systems on top of our data platform (all of them using Snowflake)
- Financial Systems: OneStream for forecasting and SAP for financial modelling
- Data Observability: Monte Carlo and Anodot to detect outliers and data inconsistencies
Motivation
As the core data platform team, we ensure the platform remains healthy while carefully monitoring and managing operating costs. At the end of 2023, we revisited the toolset used for our presentation layer, which included Snowflake and Looker.
Our data lakehouse on top of AWS S3 as a storage component is our source of truth, and is fully managed via Databricks as a data processing tool.
At the time of the assessment, Databricks offered plenty of new features tailored to support BI workloads. Additionally, removing the extra step of copying data from Databricks over to Snowflake would simplify our data environment. Thus, we wanted to evaluate a Databricks-based solution as an alternative to our Snowflake-based setup.
Our primary KPIs were the overall query performance (i.e. how long business users have to wait to load reports in Looker) and the operating cost of the query engine.
Scope of migration
Our self-service business intelligence tool Looker contains our whole business reports logic, expressed in its syntax language LookML, that builds SQL queries for fetching data from the database connection. The following numbers shall provide a better understanding of the scope of our Looker deployment and the objects that needed to be changed as part of the migration:
- We have 2 Looker deployments, one for our internal reports and one for reports for external users such as partners and suppliers
- 25 models (19 internal & 6 external) with 430+ explores
- A model is dedicated to a business unit such as HR, Sales or Marketing
- Explores can be thought of as reports (usually joins of factual and dimensional tables)
- Looker workload: 6.5M internal and 16M external queries in the first half of 2024
- 300 daily users (internal) and 1500 daily users (external)
- To ensure the correctness of the SQL syntax changes, we needed to validate 20K+ unique SQL queries
The second big part was the actual migration of the underlying tables in our data warehouse. All Looker reports used 750 tables managed by an external hive metastore. The tables were written as external tables using Apache Parquet data file format. However, considering Delta Lake offers various data layout optimizations and unified data governance via Unity Catalog, we also decided to migrate Parquet data assets to Delta tables as Unity Catalog securables.
Our database migration was supported by a range of external partners alongside our two full-time engineers leading the project internally. The Databricks account team invested in the migration and funded agency support, while Datapao, a data engineering and data science consultancy, played an important role in supporting us through the proof of concept and migration phases. Their expertise contributed to key technical enhancements, including a robust data loading component and SQL query optimizations to improve performance and efficiency.
Our Northstar goals
Our most crucial constraint was to ensure zero or minimal disruption to our Looker deployments and the external integrations. From a performance perspective, the goals were that 90% of queries should execute under 10s and more than 95% of queries should be working (i.e., no SQL syntax errors). The third constraint was that overall costs for storage and computation should be lower as with deployment before the migration.
PoC and setting the stage
Before fully committing to the migration, we ran an extensive PoC to validate our assumptions in order to fully understand the behavior and configuration of the new setup. The key objectives of the PoC included:
- enable connectivity
- compare execution times for a selected representative subset of BI queries
- find a good SQL warehouse combination in terms of cost and performance
- model business case (cost projection)
Let’s break down all the goals into single steps.
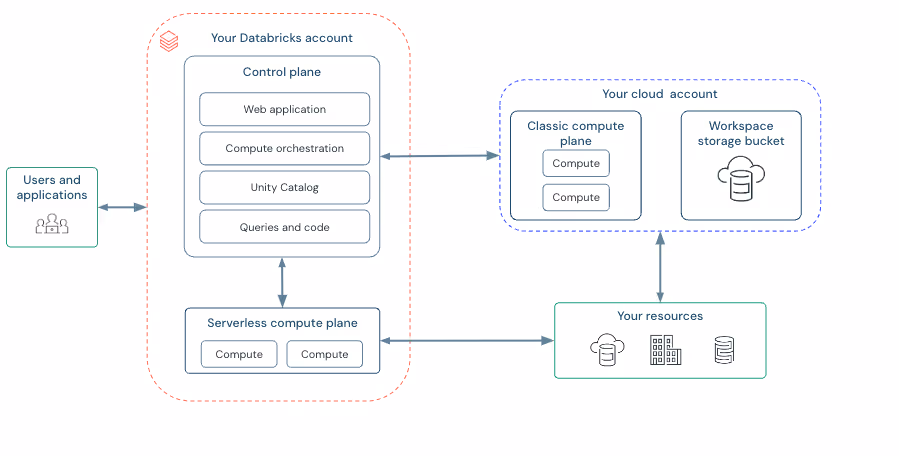
Enabling Connectivity
The Databricks Serverless compute resources (used for Serverless SQL warehouses) run in a compute layer within your Databricks account and thus have their own IP range. The challenge for us was to make our VPC and the MySQL RDS database for the External Hive Metastore from our cloud account in AWS accessible for the Serverless compute resources. Connecting Looker and other tools to the SQL warehouse was easy to implement using a JDBC/ODBC connection.
Compare BI workload execution times
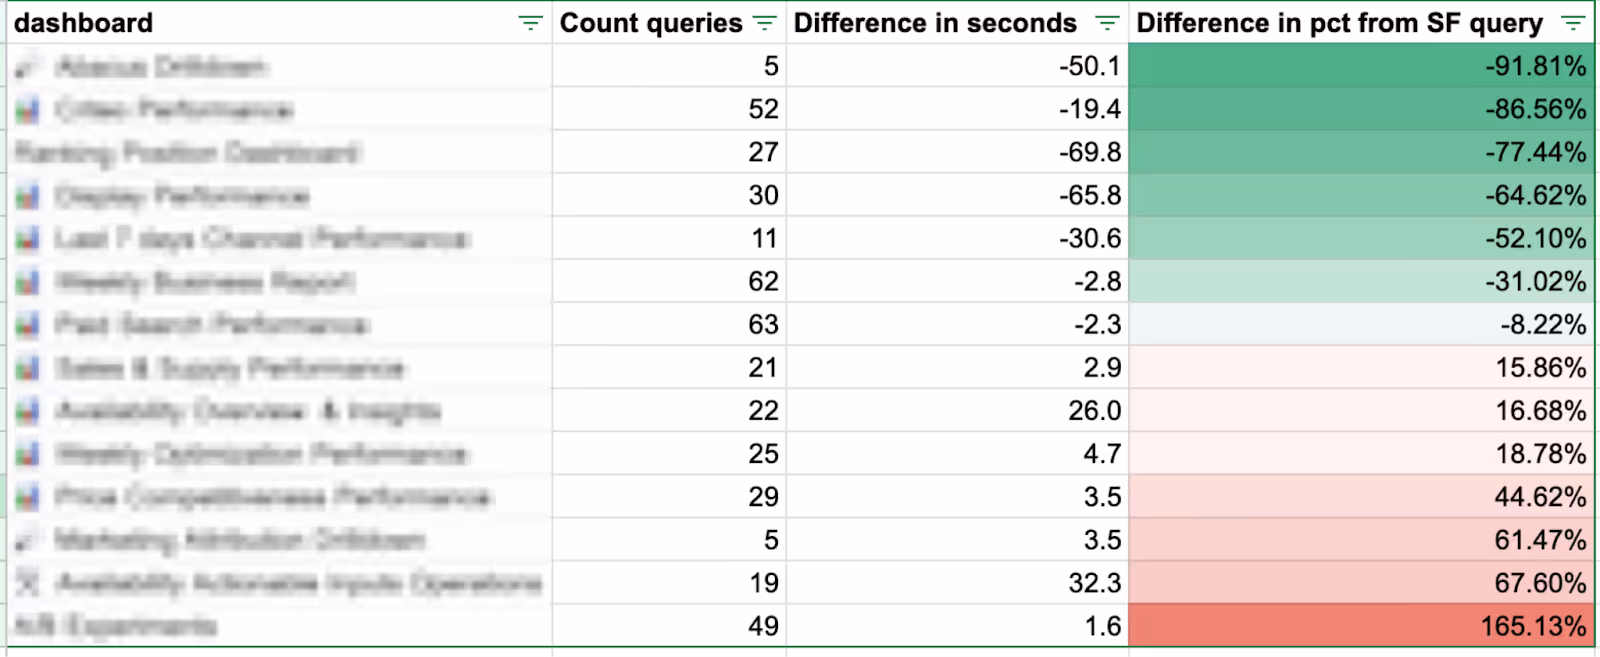
From a performance perspective, our goal was to meet or beat the query runtimes we previously achieved on Snowflake. To validate this, we compared runtimes for our 14 most frequently queried Looker dashboards by loading the necessary tables and making SQL syntax adjustments in a Looker development branch.
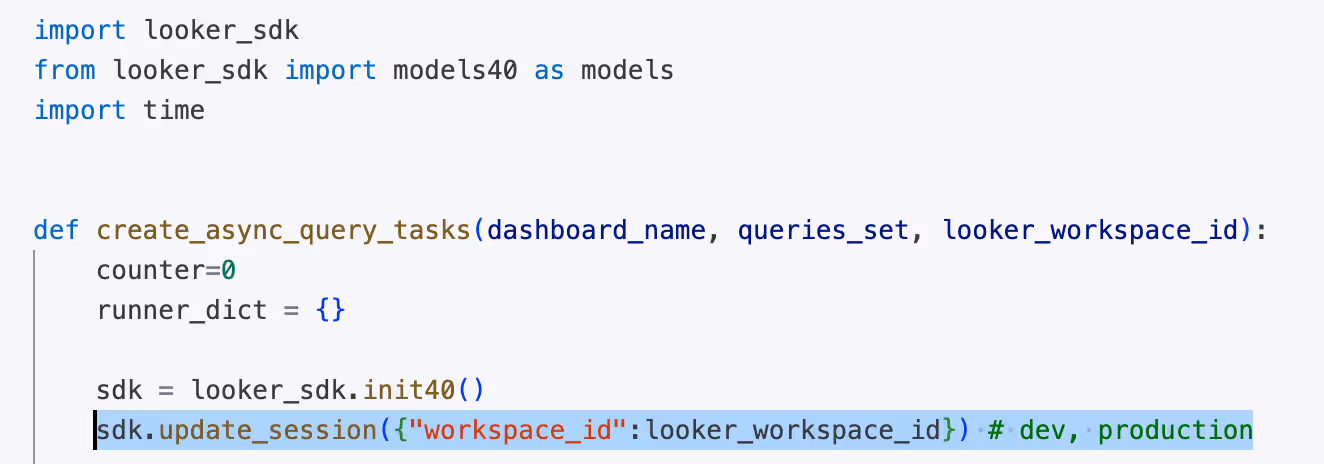
We codified the measurement process using the Looker SDK to automate and repeat tests during the PoC phase. One very handy feature to highlight is the possibility of running your queries in Looker development mode. You authenticate via your personal Looker access token, and thus, Looker is smart enough to figure out which development branch you operate on. This allowed us to execute identical queries in both production and development modes.
For the performance comparison, we relied on runtime statistics from Looker rather than the data warehouses directly, as end users care about Looker’s execution times, including Looker result caching and other optimizations. We repeated the runs 5 times and averaged the results. Of course, we also disabled the result cache for both jdbc connections.
Our findings were mixed: on one hand, some dashboards were significantly faster, while others were noticeably slower. However, we learned that by investing in engineering efforts - such as SQL query optimizations or fine-tuning Delta table configurations (e.g., partitioning columns, Liquid Clustering, or adjusting Delta target file sizes) - we could improve performance on slower dashboards.
The conclusion was that the performance benefits outweighed the disadvantages of the slower dashboards. Our rationale was that the percentage difference had to also take into account the absolute difference in seconds: a dashboard that takes 1.6 seconds longer to load but is 165% slower than the Snowflake equivalent is not as impactful as a dashboard that is 69.8 seconds faster and 77% faster than on Snowflake. Furthermore, we were confident we could optimize the performance on Databricks even further.
Find the sweet spot for a performant SQL warehouse configuration
For this task, the actual goal was to find the sweet spot between good performance for an equal (or, ideally, lower) cost. Larger warehouses (determined by T-shirt size and number of clusters) deliver faster query performance, but they also increase costs. Our benchmark was the existing operational costs of our Snowflake warehouse.
To ensure consistent performance comparisons, we applied the same conditions to both connections.
- auto-stop / auto-suspend in minutes
- Disabled result cache
Our variables for experimentation were:
- warehouse T-shirt size
- In terms of price and hardware, we found the following order being applied
- SF M < DBX M < SF L < DBX L < SF XL
- In terms of price and hardware, we found the following order being applied
- the number of clusters
- Both vendors offer autoscale, so we usually tested between a minimum of 1 cluster and a maximum of 10 clusters
To illustrate the variables, you can see two instances of the codified BI workload runs: the first run used an L-sized warehouse (with lower spikes of the maximum of queued queries in 5-minute timeblocks), and the second warehouse used an M-sized warehouse.

Cost projection
Finding an optimal SQL warehouse configuration allowed us to make a direct cost comparison between vendors. By dividing the measured Snowflake Credits by the measured Databricks DBUs, we calculated a multiplier that enabled us to project the cost on a Databricks-backed Looker deployment.
Here is how we approached it:
- Get the Snowflake Credits used in one year broken down by
- BI/SQL - this is the complete Looker workload (84% of Credits result in 80% of Snowflake cost)
- ETL - Credits used for writing data from Databricks to Snowflake; remember: we just copied over the tables needed for Looker reports from our source of truth (Databricks and External Hive Metastore), no data transformations were conducted
- Storage - no compute Credits, only Snowflake storage (5% of Snowflake cost)
- Calculate projected Databricks DBUs using the calculated multiplier
- Multiply the projected DBUs with the DBU price
- Adjusted for the optimized scenario
- In a fully optimized setup, we can set ETL and storage to 0 because eventually, there will be no additional costs as we had in the setup with Snowflake
- We have costs for ETL on Databricks anyways to write the source of truth parquet tables that are going to be replaced with unified Delta tables
- The same principle applies to storage: ultimately, we will no longer need to create reporting table copies.
- In a fully optimized setup, we can set ETL and storage to 0 because eventually, there will be no additional costs as we had in the setup with Snowflake
The following sample numbers illustrate the distribution of cost and Credits/DBUs in percentages.
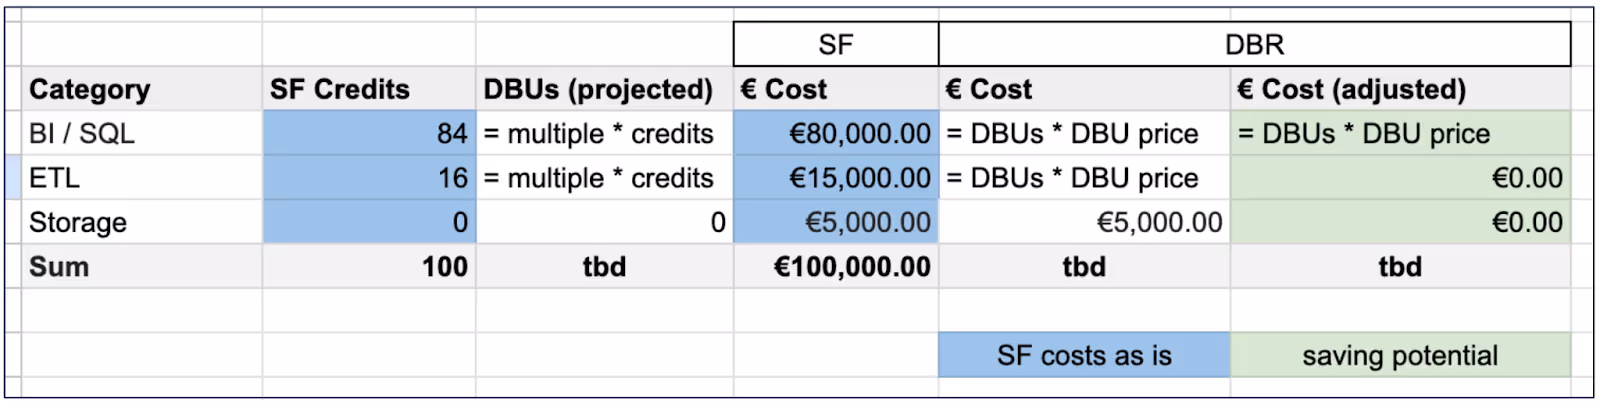
With the final numbers, that turned out positive in our case (i.e., saving potential), we were able to make an internal proposal for the full migration.
Learnings during the POC
- Codification of the measurement process for multiple runs proved to be valuable, as we had to repeat the measurement for various reasons
- SQL warehouse configuration requires experimentation with different configurations. However, it was difficult to predict production BI workloads during the PoC. Our final production configuration ended up slightly different from the PoC version.
- Cost modeling depended on calculating a multiplier from the measurement process to project Databricks DBUs accurately. To model the full business case, it is also essential to understand the cost and breakdown of your current vendor. In our case, we broke it down into meaningful categories, which helped us calculate the full saving potential.
- Plan for some additional query optimization. Even though the SQL query was the same, we had to adjust some logic in Looker here and there. The reason is that Looker has a different built-in syntax per vendor. For example, built-in functions for date filters in the UI: the filter “date is in the last 4 weeks” turns into this

- As a result, sometimes file and partition pruning was not respected in the spark query plan. We worked around these Looker syntax complexities by setting filters earlier and in a smarter dynamic manner.
- A similar topic was Delta table configuration settings, including file size, partition columns, Z-order, and liquid clustering. We focused on a few tables starting at roughly 1TB in size (compressed Parquet), and it's worth noting that the optimizations had a significant effect.
Conducting the migration
Migrating from Snowflake to Databricks requires us to replace existing Snowflake tables with Databricks Delta tables and update systems and services to consume data from these new tables. As shown in the graph below, our table loading is maintained via Apache Airflow and output tables are consumed by Looker and other systems. Therefore, the migration mainly involves three parts:
- load data to Databricks delta tables
- migrate Looker to query new delta tables
- migrate external integrations to use new delta tables
We will cover each step one by one in the subsections below.
Load data to Databricks delta tables
In total, we have around 750 Snowflake tables to migrate to delta tables with some dependencies between them. For example, table A depends on table B, and thus we should load table A only after table B is loaded. To manage this complexity, we utilize a centralized configuration to configure the loading process.
As shown in the script below, in this centralized configuration file, one can define the Airflow dag and task_id as the data source, and output delta table information. Additionally, one can also add extra parameters for some loading tasks.
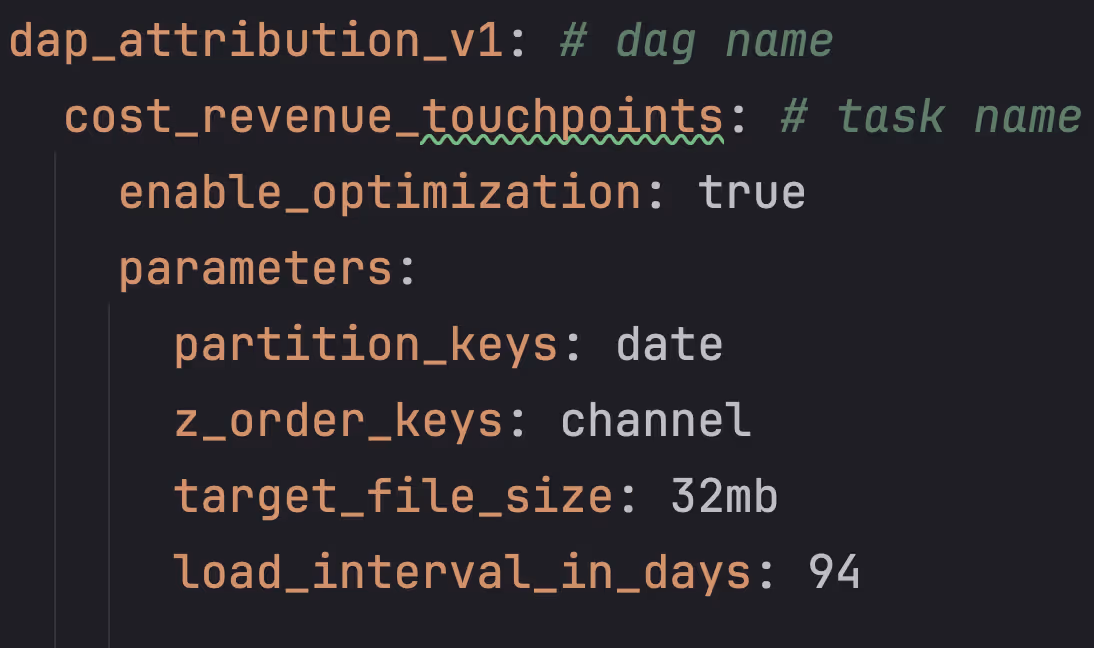
The above configuration creates a load task, as shown below.
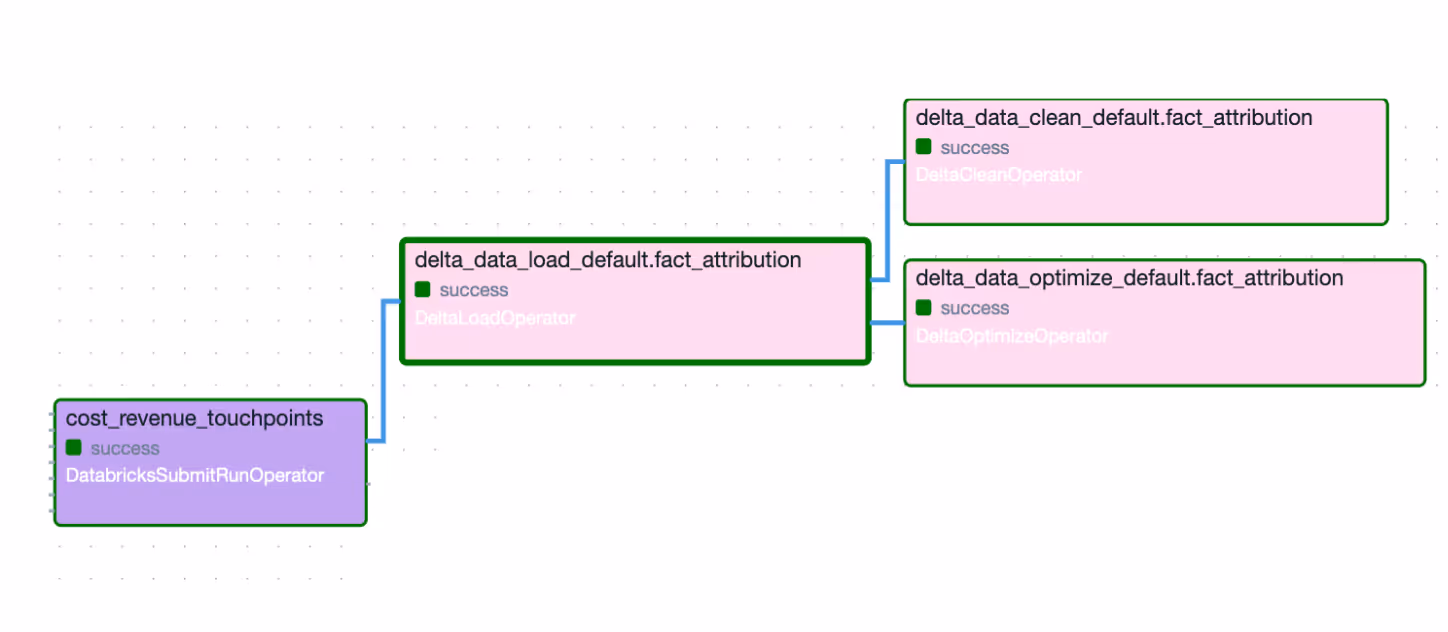
The centralized configurations not only helped us to maintain the configuration more efficiently but also eased the monitoring process. We set up a daily workflow to check if configured tables have been loaded correctly and have all the data. So, during migration, we have this guardrail to ensure tables are migrated smoothly and safely.
Looker migration
Incremental roll-out plan
Once the data is ready in delta tables, we need to switch data sources in Looker from Snowflake to Databricks tables. Since Snowflake and Databricks SQL have syntax differences, we had to adjust queries to ensure compatibility with Databricks SQL. Moreover, we need to ensure query performance and data consistency after migration, especially as our major business report is based on tables in this migration.
Because Looker projects can import views from other projects, updates can break other projects. Given the complexity and interconnected nature of our non-trivial Looker projects, a full migration in one batch was not feasible. Instead, we conducted an incremental rollout plan to ensure smooth migration. Another benefit of this incremental migration is increasing parallelization, allowing developers to work independently.
Specifically, we
- analyze Looker view references statistics to understand dependencies
- duplicate views used by multiple models
- migrate a model with newly duplicated views to avoid affecting other models
- identify common syntax differences and apply changes in bulk
Rollout dashboard
We built a Looker dashboard to track migration progress, as shown below. It presents the quantity and quality of migrated models and helps us ensure our success metrics are achieved.

SQL syntax changes
To bootstrap our syntax change process, we utilize Looker API to spot syntax errors and identify the common incompatibility errors.
- Snowflake SQL supports adding quotes to table names, whereas Databricks doesn’t
- The same function name but a slightly different behavior, e.g., Lateral
- Functions with different names, e.g., json_extract_path_text in Snowflake but get_json_object in Databricks
- Recursive Common Table Expression (CTEs)
- …
With all identified issues, we developed automation scripts to incorporate desired changes and fix these incompatibility issues at scale.
Validating data correctness and query performance
With all the changes in Looker, we validate data correctness and query performance before rolling it out. We have made changes in the development branch. Thus, we must compare the development branch with the production branch. Yet we have a few challenges: 1) We have too many queries and tables to check, 2) A query execution time is a few minutes and can go up to tens of minutes, and 3) It is hard to compare results in two environments as Databricks and Snowflake provided slightly different query results, e.g., different precision for the same tables with the same data and same SQL statements.
To address the above challenges, we took the following validation approach,
- Only looking at the top 150 queries in the recent 3 months for each model to avoid stale models and also focus on the core part of the migration.
- We use Looker API to evaluate data correctness and query performance in two environments. We implement a comparison function to tolerate relative and absolute differences between query results to further automate the validation.
- Comparison results are cached to avoid computation costs for re-evaluating validation-passed queries.
The Looker migration involved the most workload in this project due to its scale, complexity, and criticality. However, our incremental rollout plan, a live rollout dashboard, and automated migration and validation pipelines led to a smooth and successful migration for Looker.
Results
- The proof of concept (PoC) required one full-time engineer working for 1.5 months.
- The migration, including both Looker deployments and their external integrations, took approximately 4.5 months with an average of two full-time engineers. This compares favorably to the industry average of 7 months (as measured by Databricks for similar customers and workload sizes). The process featured an incremental rollout of Looker models with no significant reporting issues.
- We’ve centralized our data processing in one platform, and while we’re on track with our cost projection, we are still optimizing toward our ambitious performance goals. In Q4 2024, we had 98%+ working queries (correct SQL syntax) and 72% of queries running under 10s, which was in line with our query performance on Snowflake (we’re aiming towards 90% here).
Our Learnings
- Aim for an incremental rollout so that you can parallelize migration workloads. For our migration, the following components helped us distribute the migration of single Looker models:
- Assign ownership to individual engineers for separate workloads (end to end, including bug fixing post-roll out)
- Collect necessary metadata from your BI tool. It helped us identify which tables had to be loaded and narrow down which Looker views needed SQL syntax changes.
- API bulk processing via Looker API: Provide tooling for the engineers to run queries and validate the results in bulk.
- Monitoring and automated data validations ensure production report quality. Source tables and reports had to match the previous setup. You want to be able to catch anomalies as early as possible.
- Define targets and target monitoring in advance. Examples are the migration progress and quality metrics, such as error rate and number of queries meeting the performance goals.
- Plan for post-migration optimizations. To monitor spend and usage of the new query engine, use cost and performance tracking. This entails optimizations to the SQL warehouse configuration and changes to your SQL queries and the data layout (i.e. properties of the delta table like target file size and more).

More articles like this