Improving User Experience by Boosting Runtime Performance (Part 3 of 4)
Senior iOS Engineer Bruno Rovea leads us through his team’s wide-reaching project to optimize the runtime performance of the GetYourGuide app. This time, it’s all about images – size, format, effects, and more – and how to get the most out of multithreading.

iOS Engineer
Key takeaways:
Here, Senior iOS Engineer Bruno Rovea leads us through his team’s wide-reaching project to optimize the runtime performance of the GetYourGuide app. This time, it’s all about images – size, format, effects, and more – and how to get the most out of multithreading.
{{divider}}
In the last blog post, I talked about building the app screen from a hierarchy of subviews and constraints, as well as ways in which developers can impact runtime through actions such as rasterization and its counterpart, asynchronous drawing. We also touched on best practice points, such as checking for unnecessary mask usage.
Next up: images, and how to multithread effectively.
Improving UX in iOS: Local versus Remote Images Meet Memory Footprints
Images are a common UI element in all apps, bringing semantic value in form of icons and informative value in form of illustrations. These qualities make images a powerful tool for communicating with users. Image resources can be local, by being bundled together with the app; or remote, by downloading them on demand when needed. For both approaches, we are subject to similar performance penalties when dealing wrongly with the resources. For this reason, we need to take into consideration several factors like rendering performance, memory consumption, and data consumption.
Size: The most important aspect of images is size. Images should ideally have the exact same size as the frame in which they will be presented, otherwise, the system is forced to redraw every single image before every single usage. Not only does this unnecessarily use resources from the Main Thread, but it can also significantly increase the app runtime memory footprint due to how the system deals with this kind of resource.
{{quote}}
It's possible to check if an image is suffering a considerable resizing to fit a frame by running the app in the Simulator with the Color Misaligned Images option enabled inside the Debug menu. This will tint the affected images in yellow, meaning the image has been automatically treated to be displayed.
Format: Images should have file formats and color schemes supported by the iOS, like JPG and PNG, and sRGB and P3 for example, so that they can be rendered using the GPU. Any unsupported format and scheme make the image be transformed by the CPU, which is much slower, affecting the app's performance.
This can be checked by running the app in the Simulator with the Color Copied Images option enabled inside the Simulator's Debug menu or in Debug -> View Debugging -> Rendering menu inside Xcode. This will tint the affected images in red or blue depending on how expensive it is.
Effects: UIViews, or in this specific case UIImageViews, that receive any kind of effect/transformation, like rounded corners or alpha change, are rendered off-screen. This means the render will be done by another GPU context, which can affect the app performance when syncing the on-screen context with the allocated ones to handle off-screen rendering.
Refreshing our memory: This can be checked by running the app in the simulator or device with the Color Off-screen Rendered option enabled inside the Simulator's Debug menu, or in Debug -> View Debugging -> Rendering menu inside Xcode. The result will be to tint the affected layers in yellow: this doesn't mean we shouldn't use these effects, but should be mindful of them.
Our use case:
- Remote images:
By providing thousands and thousands of Activities for our users, it's natural that we rely on remote images to present them. While showing a remote image is as easy as downloading it and applying it to a UIImageView, we need to handle the aforementioned factors of size, format, and effects.
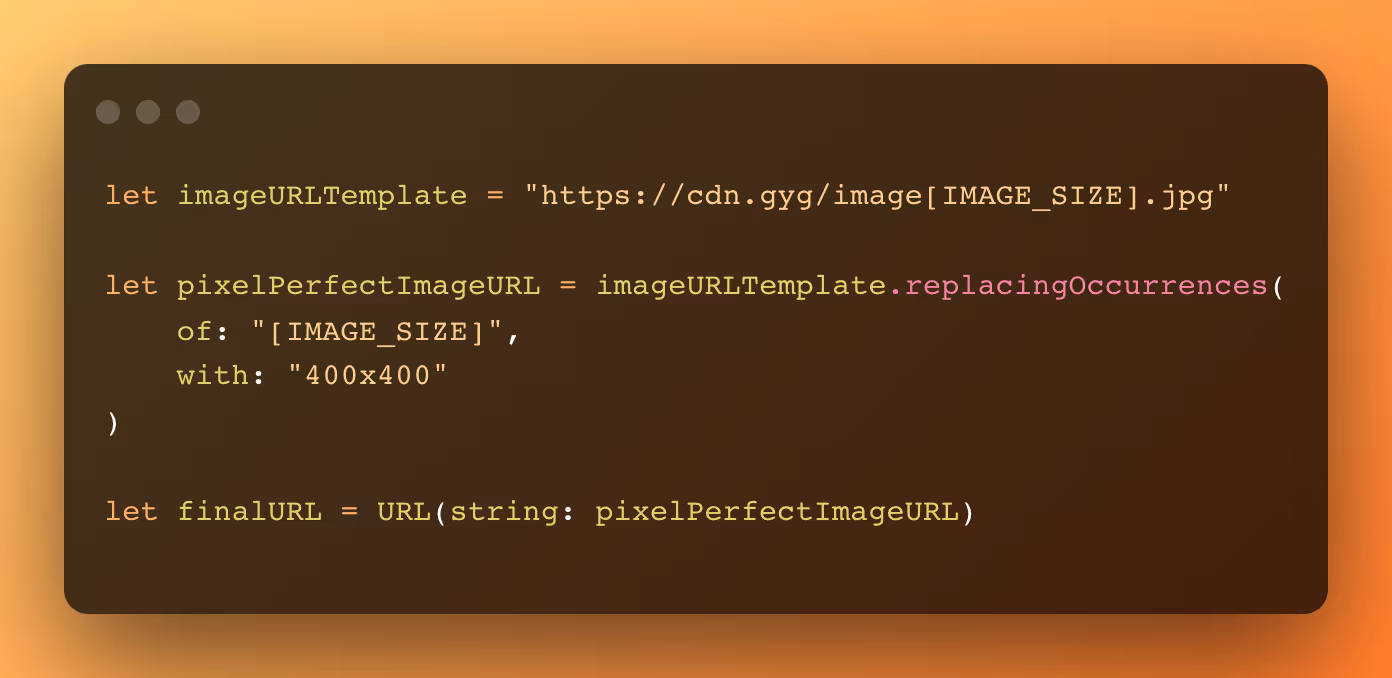
To that end, we have multiple available sizes for every single remote image in a supported format, available through different URLs. Each image URL is created in runtime, taking into consideration the exact frame in which it will be presented, so using the most approximated size available in our services. This means that we download the most optimized image for each use, which are minimized in numbers due to our design system limiting the number of possible sizes for the same content.
The pseudo-code for it looks like this
Each downloaded image is then cached so it can be reused. This means we are saving data transfer, data processing, and memory consumption.
At the moment we use a third-party framework to handle the download and caching of remote images.
- Local images:
While the Activities need to rely on remote images, commonly used icons and illustrations across the app can be bundled together to improve responsiveness and help save on the user's data transfer. This solution increases the app size, meaning it's important to monitor this approach to local images.
The size of these images should be optimized according to where they will be used since we face the same problems as when dealing with remote resources. This can be achieved by replicating the same resource which is not optimal, or creating and caching local versions to be reused across the app, which is the approach we took.
By creating a local in-memory cache, we create on-demand optimized versions for the most reused icons that need to be transformed, which are returned in the next use.
The local cache can be an NSCache, which contains built-in memory management, or even a simple Dictionary, which then needs to be managed by the developer. We opted for the second option since access through a simply managed dictionary was much faster than using the NSCache as we confirmed by using the Time Profiler instrument.
A basic code for resizing an existing UIImage can be seen below:
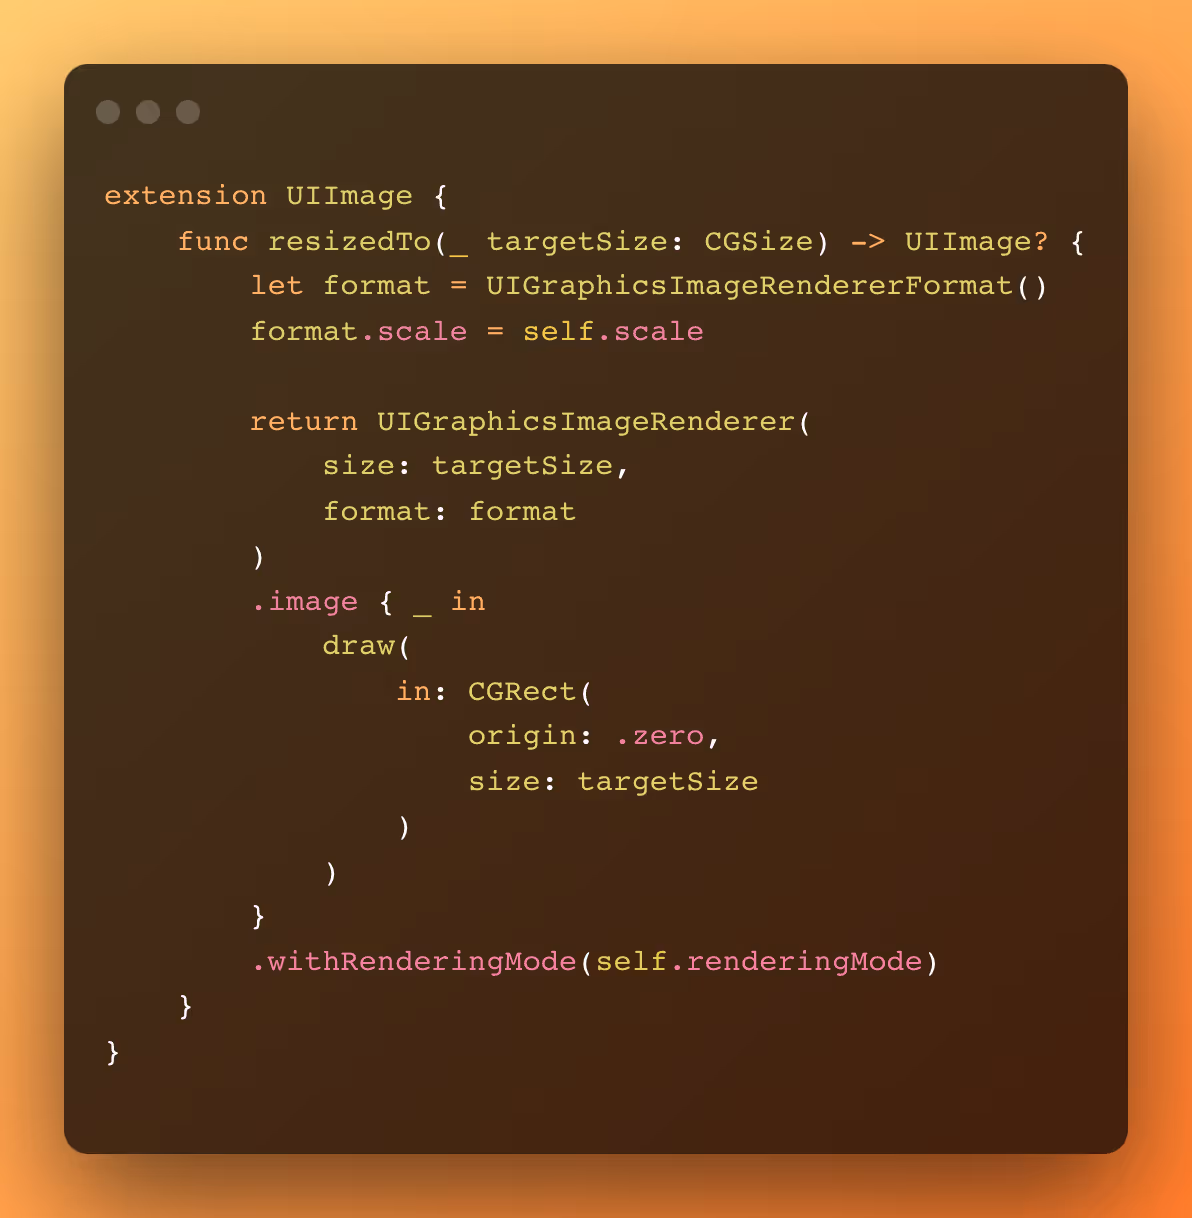
It is important to note that we are not dealing with aspect ratio and contentMode here, so if changes are needed, the function needs to be updated accordingly.
Note the approach above is using an in-memory image, meaning the aforementioned footprint is being used. If we need to downsample an image without first increasing the memory footprint, we should use other APIs like ImageIO, which will handle the resource before transforming it into a UIImage.
For both approaches, we are dealing with size and format, but we are not handling effects, which are currently not used so much in our app. We, therefore, don’t need to deal with degrading performance from effects. If we did, we would need to apply the effects in the UIImage itself and not in the UIImageView, presenting it using the same UIGraphicsImageRenderer function above.
First, we take the example from the Layer blending point in part two in which the UIImageViews with the icons were not blended. This is because those images have an alpha channel, which prevents them from blending with the layers below, even if setting the UIImageView background color. To tackle that we need to remove the alpha channel and tint the background color.
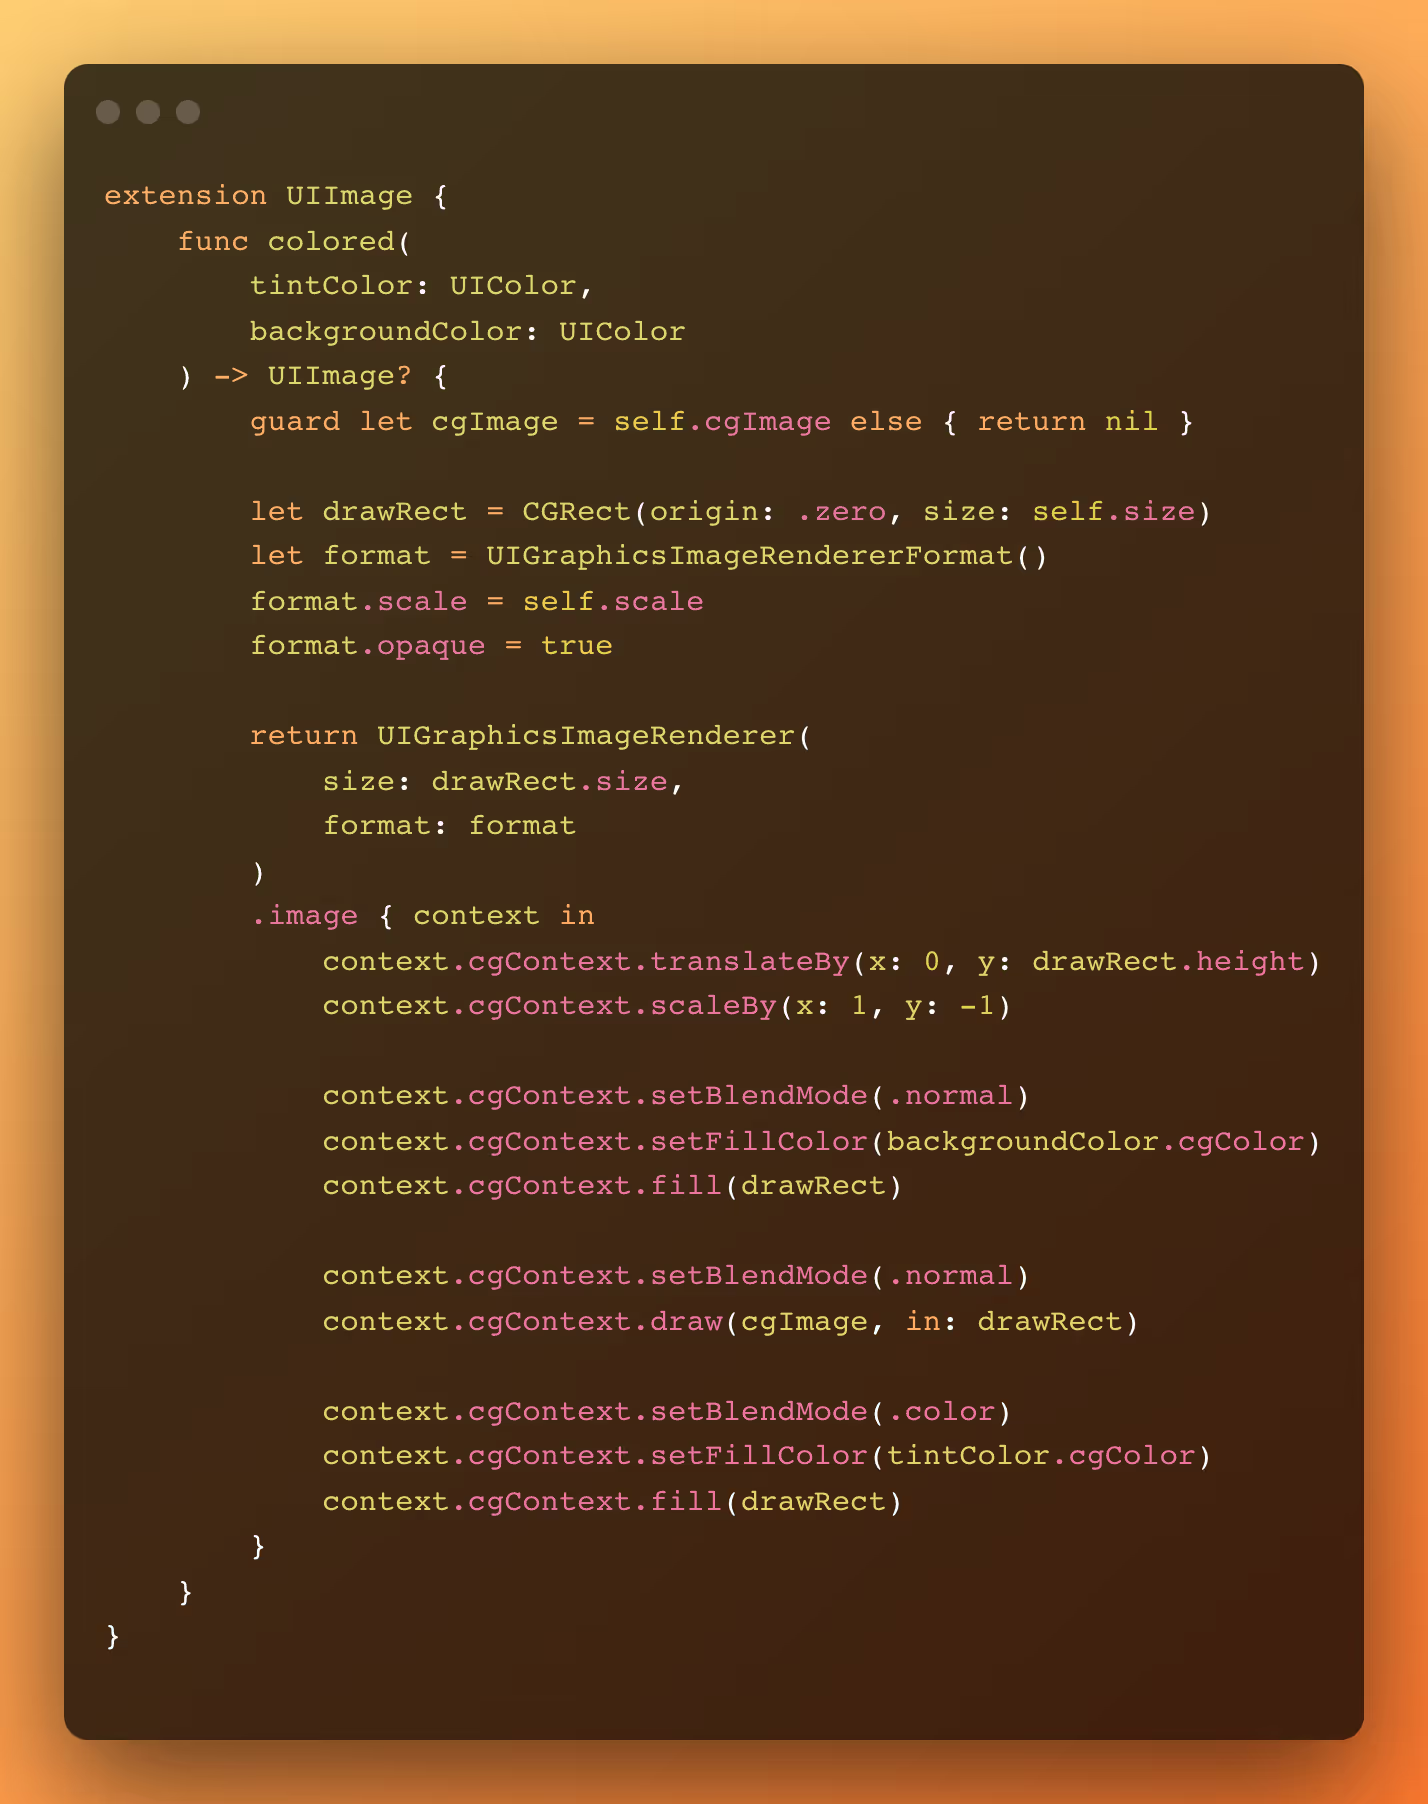
And now our UIImageVIews with UIImages with alpha channel are also blended:

Now taking the example from the Off-screen rendering point from part two, we can apply the cornerRadius directly on the UIImage instead of applying it to the UIImageView.
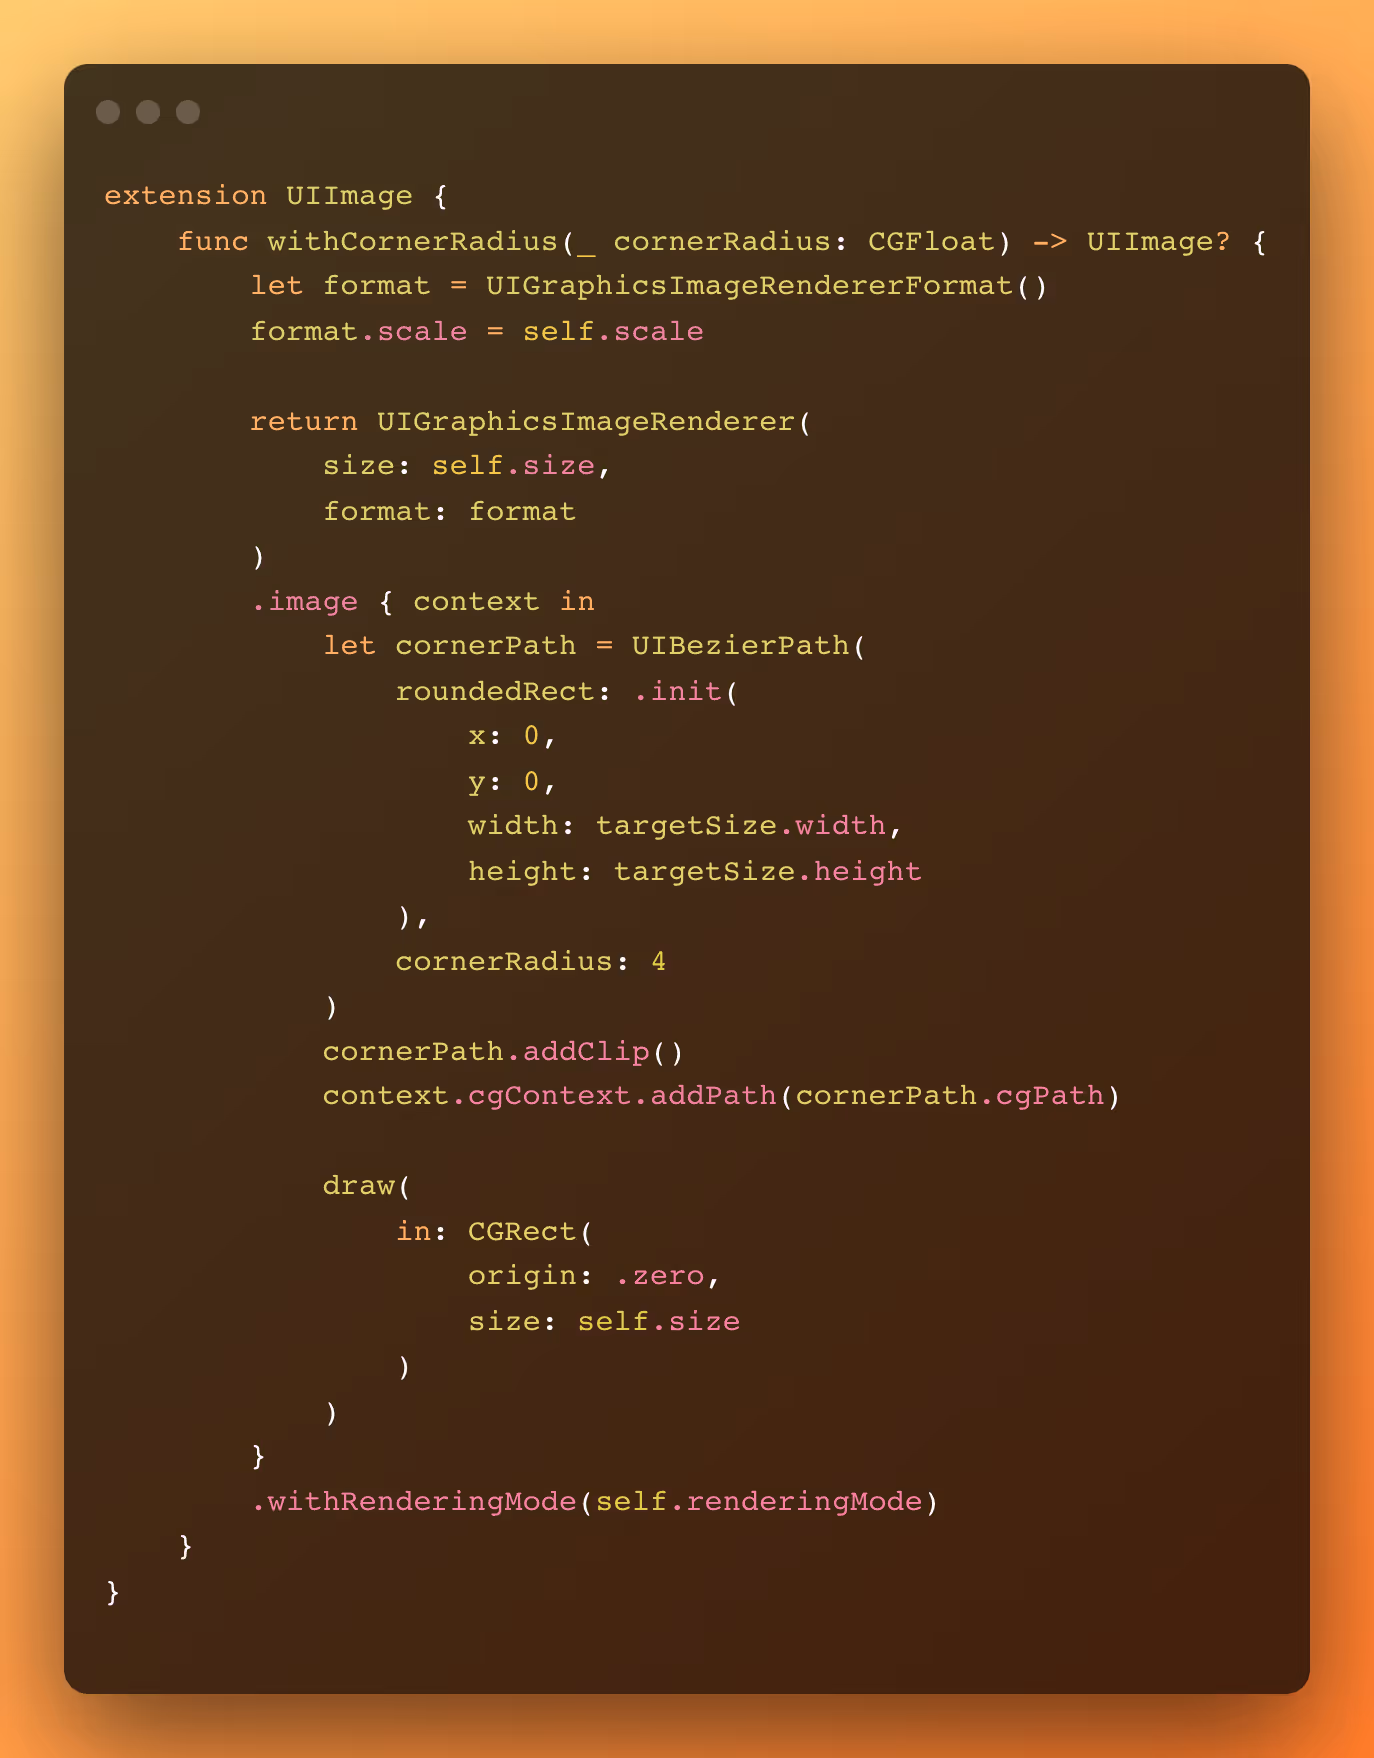
This change delivers the same UI without doing off-screen rendering.
As bonus points:
- All the logic above can be done outside the Main Thread, so we can make use of idle resources to optimize our imagery performance, while not degrading the user experience.
- From iOS 15, Apple provides new APIs to help us with part of this work, like the prepareForDisplay and prepareThumbnail functions, so if your app only supports iOS 15+, you can already make use of them.
Multithreading
The Grand Central Dispatch is a powerful tool that although sometimes overlooked or underused can help increase the app performance by making (better) use of multithreading. It helps us instruct the system how we want to run specific actions/blocks of code, either by using semantic Quality of Service classes or being directly controlled by the developers when building custom queues, while using a simple DSL to do so.
While simple screens or even simple whole apps can have the benefit of not worrying with multithreading – by running everything in the Main thread – most commercial apps run a lot of underlying tooling to provide a better user experience for the current and new versions. They include logging, tracking, prefetching, and more. These tools, if not well manipulated, can start to make use of precious resources from the Main thread, which as we pointed out earlier should be as free as possible.
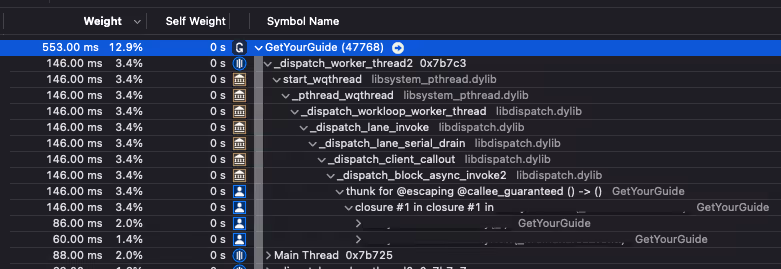
Making a new run of Instruments with Time Profiler, Hitches, and Core Animation FPS we can check which actions not related to UI or that the user shouldn't be affected by, are running in the Main thread and could be affecting the app performance.
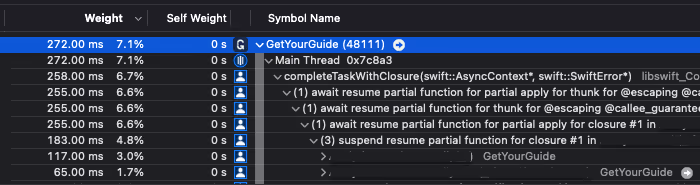
Note that the Weight column doesn't show how much time each function takes to run once, but how much time it was present/running in total in all the samples Instruments took while profiling. This means that very fast functions won't appear since they were never present in the samples. The data we present here is trustworthy only because we used a script to run the exact same actions at the exact same time, so there wouldn't be any human interaction that could affect the results. If you check it on your project, I would highly recommend doing the same.
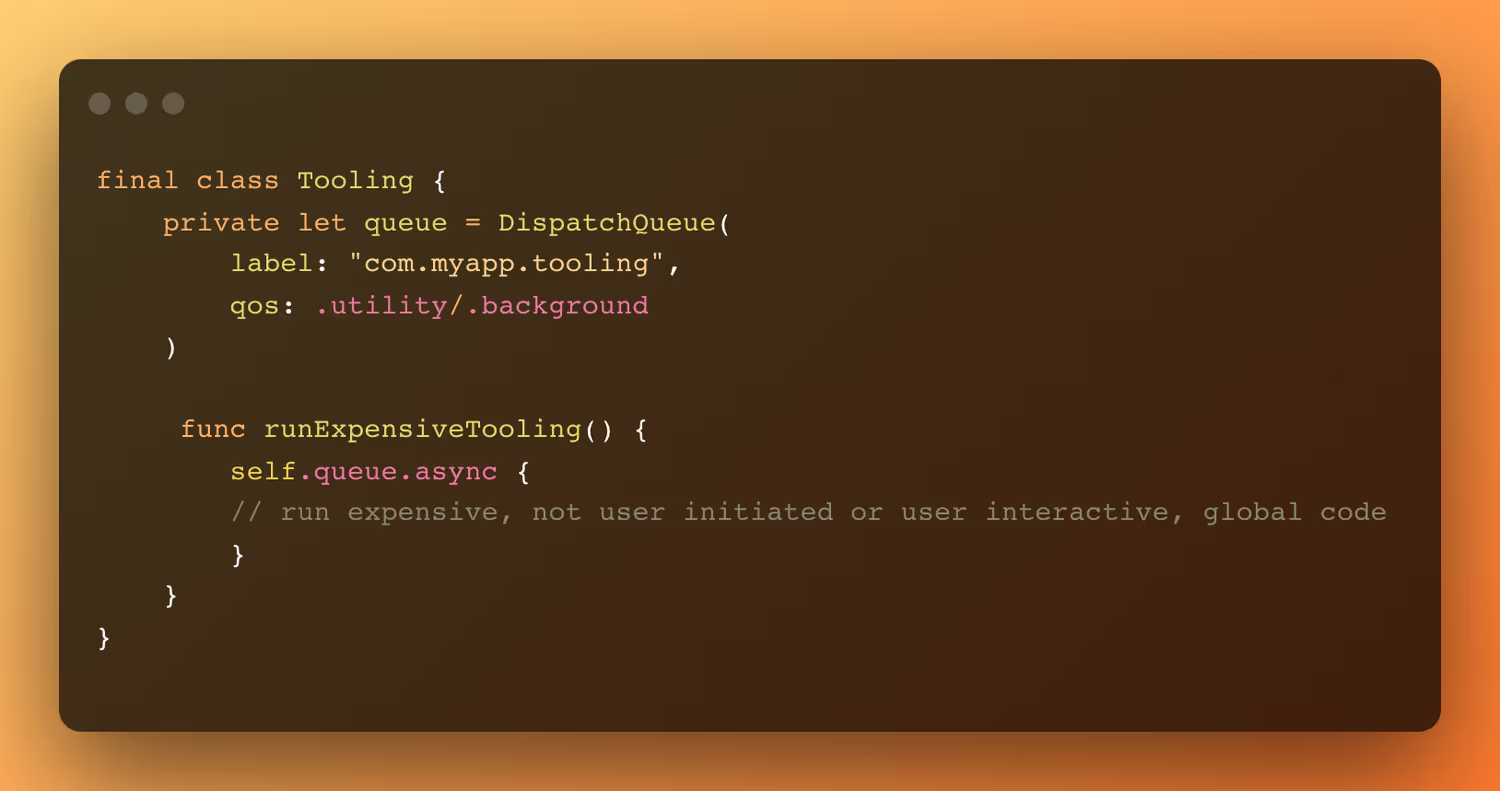
In the example below we found that part of our utility tooling was being executed in the Main thread for the whole app.
Making a small change directly where the tooling is done, so the whole app could benefit from it, brought enormous gains for the whole app, but especially for our screen. That’s because every time a new Activity Card component is shown we need to run our tooling.
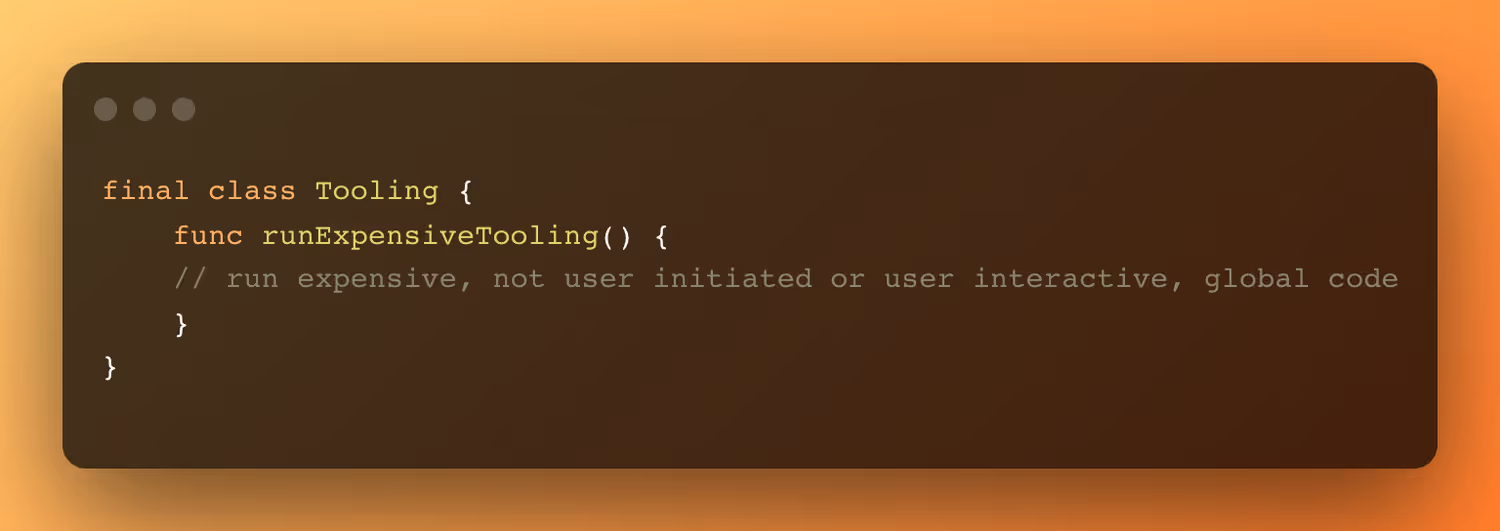
To
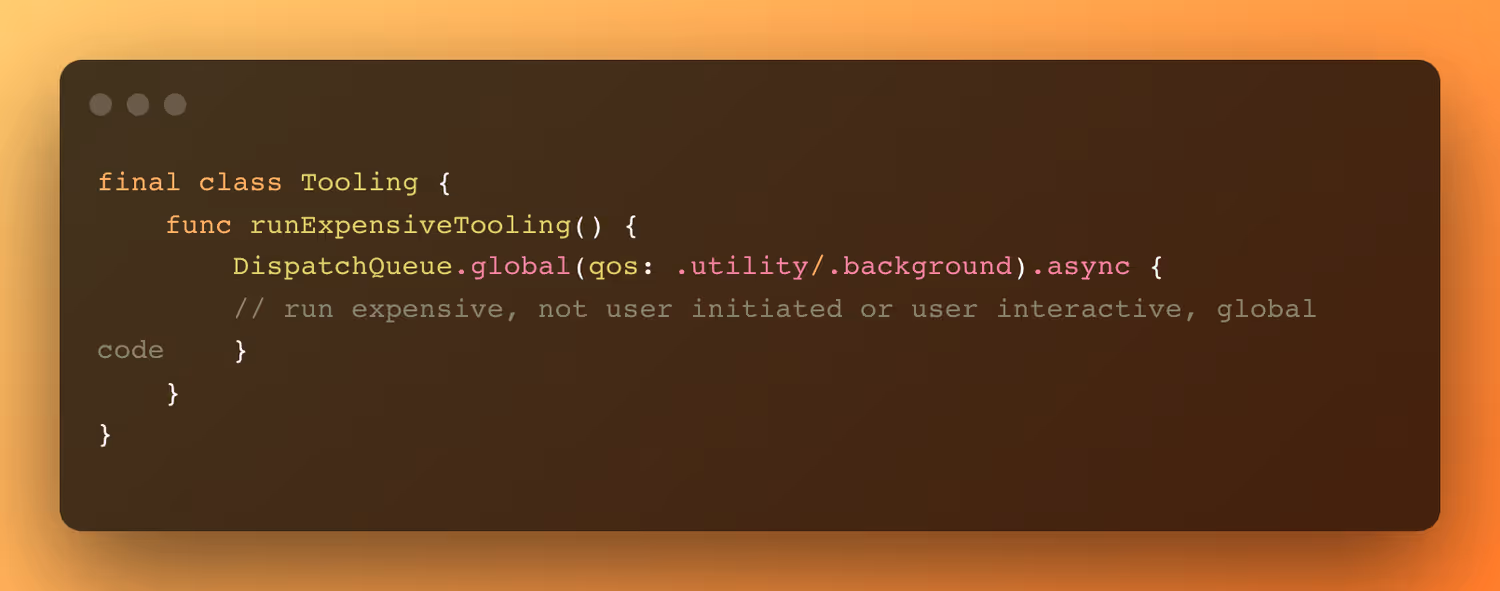
We can make use of the global queues provided by the system. However, if, for example, this is something that will have the same lifecycle as the app, we could create a specific labeled queue for it, which would make it easier to debug if needed.
As we can see it is now running in another thread, removing the burden from the Main thread.
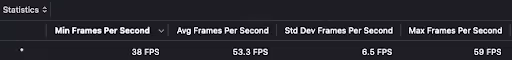
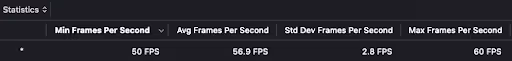
This change is so powerful that only applying it dropped the number of animation hitches by ~35%, and improved the average FPS by ~7% and the minimum FPS by ~30%, alone.
Before:

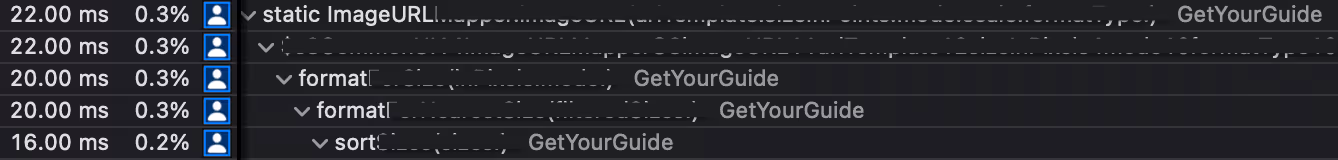
After:
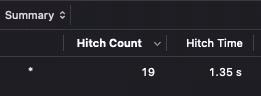
But what about the tasks that need to run in the Main thread, but are expensive? Well we can also use Instruments to find them and try to optimize them. This is how we found another app-wide function that was taking much more time than needed to run, but could not be dispatched in another queue because of how it was being specifically used.
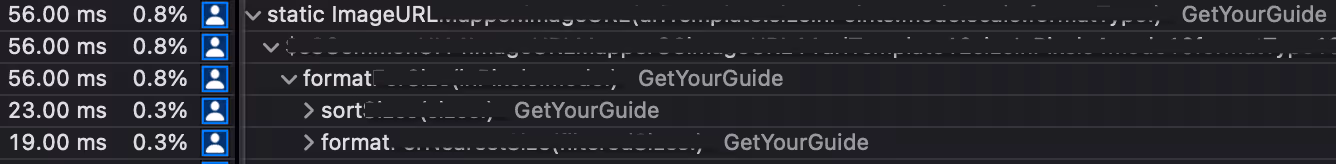
This function is the one used to find the most optimal remote image size. We use a series of IDs and try to find the one that best fits each image frame. The problem with this function was not that we needed to run through the whole list of IDs to find the most suitable one, it was that we were recreating and sorting the list every single time we asked for an ID. In an app where we may be able to show thousands of images in a single session, this is computational power being thrown away. By simply changing the logic and caching the list after it's first sorted, this is the result we achieved:
Remembering that for expensive functions we can use the measure test case to prevent regressions.
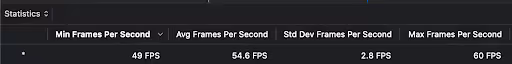
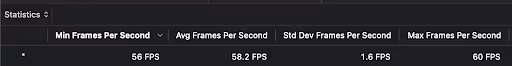
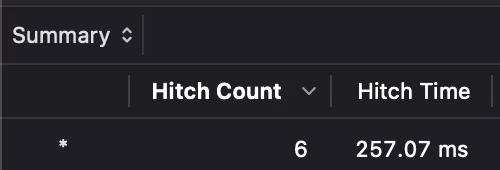
These changes are so powerful that by only applying them in isolation we were able to drop the number of animation hitches by ~70%, improve the average FPS by ~3% and the minimum FPS by ~30% when comparing to our benchmark seen in part two. The result can be seen below:
In theory everything that does not affect the user interaction should be done in a separate thread other than Main by using the semantically defined QoS classes. Of course this may bring more complexity to how we architecture and build our app, especially if we start spawning new queues, which can decrease the app performance by making use of time slicing, or for handling deadlocks and thread explosion. So, as a rule of thumb, we could say to at least invest in running all the tooling in separate threads and explore a more refined (and complex) approach when necessary. For tasks that should run in the Main thread for any reason, profile it and try to find possible optimizations so it can decrease its running time footprint.
For a more in-depth understanding of this topic, I highly recommend watching this WWDC video.
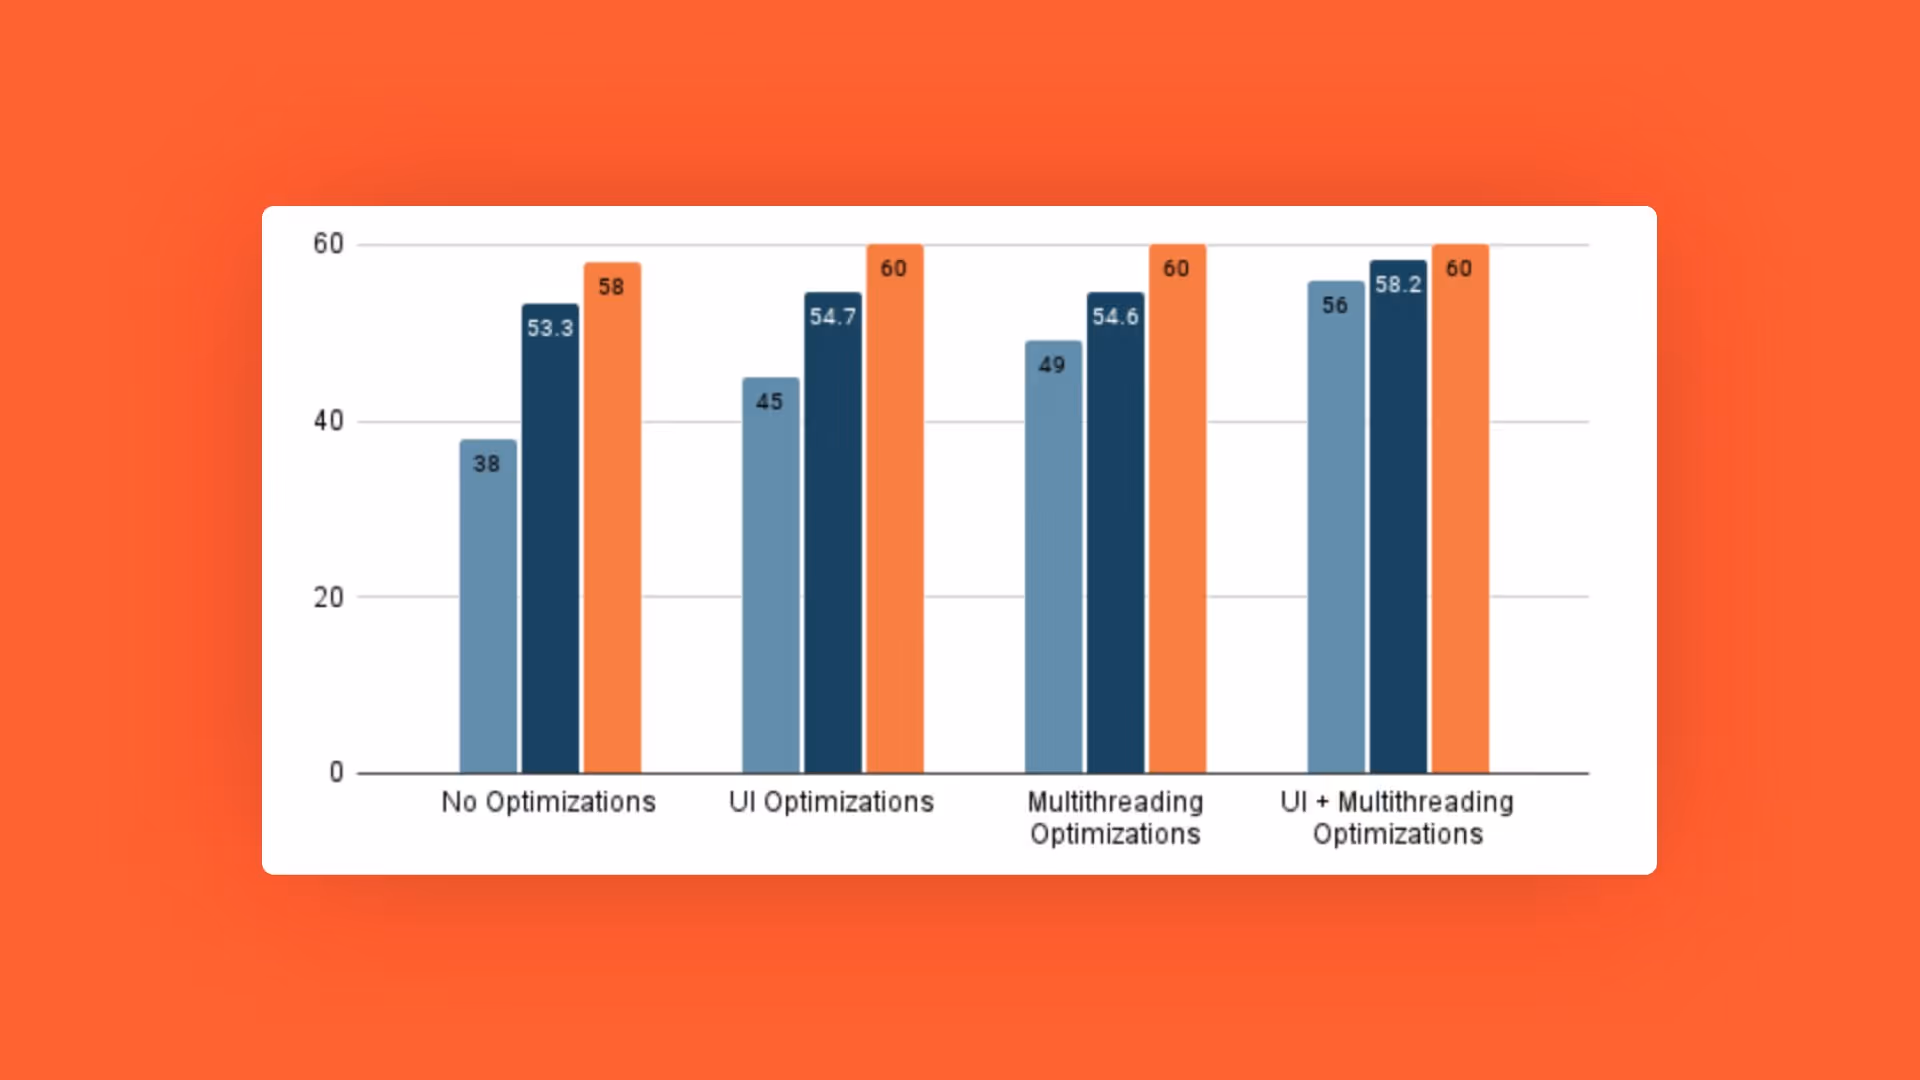
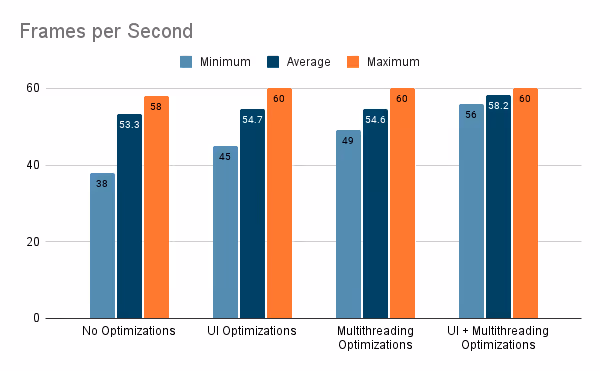
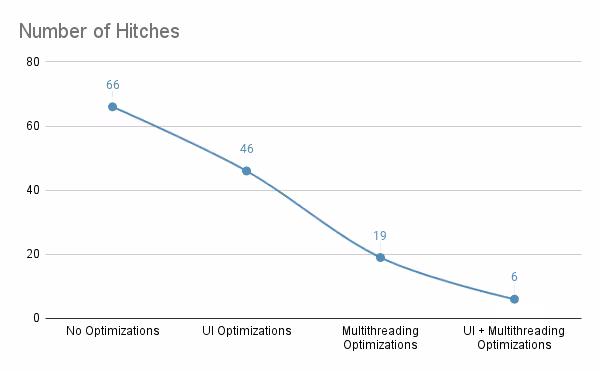
And here we can check the final result after applying all the improvements seen in this series:
For a better visualization on all the changes done, we can validate the improvements of each topic covered:
In the next blog post in this four-part series, we’re going to take a look at networking, which plays a significant role in an app’s latency.
To give an example: Let's say we have an image of size 500x500 with a file size of 25KB – we may expect that this is how much RAM it will consume in runtime, right? Well, no: the way the system deals with images is around the number of pixels in the image, using 4 bytes per pixel (3 for RGB and 1 for Alpha), meaning the 500x500 image actually has a footprint of 1MB (40x the original file size). It may not sound a lot, but in an app that deals with tens, hundreds, or even thousands of images, it makes a huge difference: not only does it slow down the app, but it can also cause memory spikes making the iOS force close the app.
iOS Engineer
More articles like this