Improving User Experience by Boosting Runtime Performance (Part 1 of 4)
I joined GetYourGuide in January 2021, as the first iOS engineer in what was then called the Search team.

iOS Engineer
Key takeaways:
It doesn’t take many milliseconds for users to dismiss an app as slow. That was the starting point for Senior iOS Engineer Bruno Rovea’s project to improve User Experience in our own app by boosting runtime performance, and for the first of a four-part series centered around iOS.
{{divider}}
I joined GetYourGuide in January 2021, as the first iOS engineer in what was then called the Search team. It was an exciting time of team restructuring, with new verticals being created in order to better split responsibilities along the features we provided as a product. The changes also coincided with a new era for Native Apps in the company, which was moving to a mobile-first mindset. On a practical level, it meant a welcome boost in numbers from just two engineers per platform before, to around twelve today. That boost in capacity was game-changing: although the first line of code for the GetYourGuide iOS project was written in 2012 — with some chunks of the original code still running today — the focus had necessarily been on new features, rather than runtime performance. Fast-forward to now, and my colleagues and I have capacity to build on the great work that has already gone into the app, and work towards improved performance.
So, with the time, people, and space to target potential improvement points, my first initiative in the company was to migrate, modularize, and modernize the Search Results screen. One of our most important screens in the funnel, it is second only to the Activity Details screen for top place by number of views.
The migration consisted of consuming our new services, while the modularization consisted of decoupling and moving all the code from our main module (monolith) to a feature module. The modernization involved migrating all existing Objective-C code to Swift, while keeping compatibility with the rest of the codebase and existing flows. Happily, a couple of months after starting the project everything was done, released, and live, with our users enjoying the updated UI and UX while taking advantage of a much faster service and optimized code.
Much of this work comes down to the daily tasks that keep iOS engineers busy: things like memory leaks, multithreading, optimizing Method Dispatch, and balancing the use of value and reference types. Nevertheless, I felt we could do much more for our users – particularly since the new screen was having hiccups on older devices, which was affecting the user experience. After undertaking a thorough assessment of both the Search Results screen and the whole app, we identified many improvement points. These fixes boosted performance and by consequence, the user experience.
In a series of four blog posts, we are going to explore the findings and show some results from each improvement. Additionally, we’re also going to discuss improvements that were not used by us but can benefit others. Note that at the time of writing and development for backward compatibility reasons, where we are supporting iOS versions 14 and 15, we were handling UI with UIKit and multithreading with GCD, so SwiftUI and Actors were not considered, but many points can be easily transferred.
The Rationale
When we talk about UI optimizations we first need to understand how it affects the users. Most authors define the threshold for a fluid or seamless experience as the result of a user action taking up to 100 milliseconds (ms). This could be a character typed being shown on the screen; scrolling a list to see more items; or even an action that triggers an asynchronous task, like a network call. When the latency is greater than that, it makes the users unconsciously and later consciously feel blocked by the interaction being done.
"We are not accustomed to measuring our everyday encounters in milliseconds, but studies have shown that most of us will reliably report perceptible “lag” once a delay of over 100–200 milliseconds is introduced into the system. Once the 300-millisecond delay threshold is exceeded, the interaction is often reported as “sluggish,” and at the 1,000 milliseconds (1 second) barrier, many users have already performed a mental context switch while waiting for the response—anything from a daydream to thinking about the next urgent task."
Ilya Grigorik, High-Performance Browser Networking (O'Reilly Media, Inc, 2013)
This affects the business since people will bounce from the app and look for other solutions for their problems and needs. Actually, several companies such as Amazon, Google, Farfetch, and others found that every 100 ms in latency decreases their conversion rate, meaning every millisecond counts.
While we can't control everything in the user environment like the device and OS they are using, we can try to optimize it by basing how we handle the UI rendering on any iOS app. For this, we need to understand how screen rendering and layout updates work. Below we explain the basics of the iOS system, which uses the Render Loop to control it. (If you prefer to have a complete understanding of the topic, I suggest watching this WWDC video)
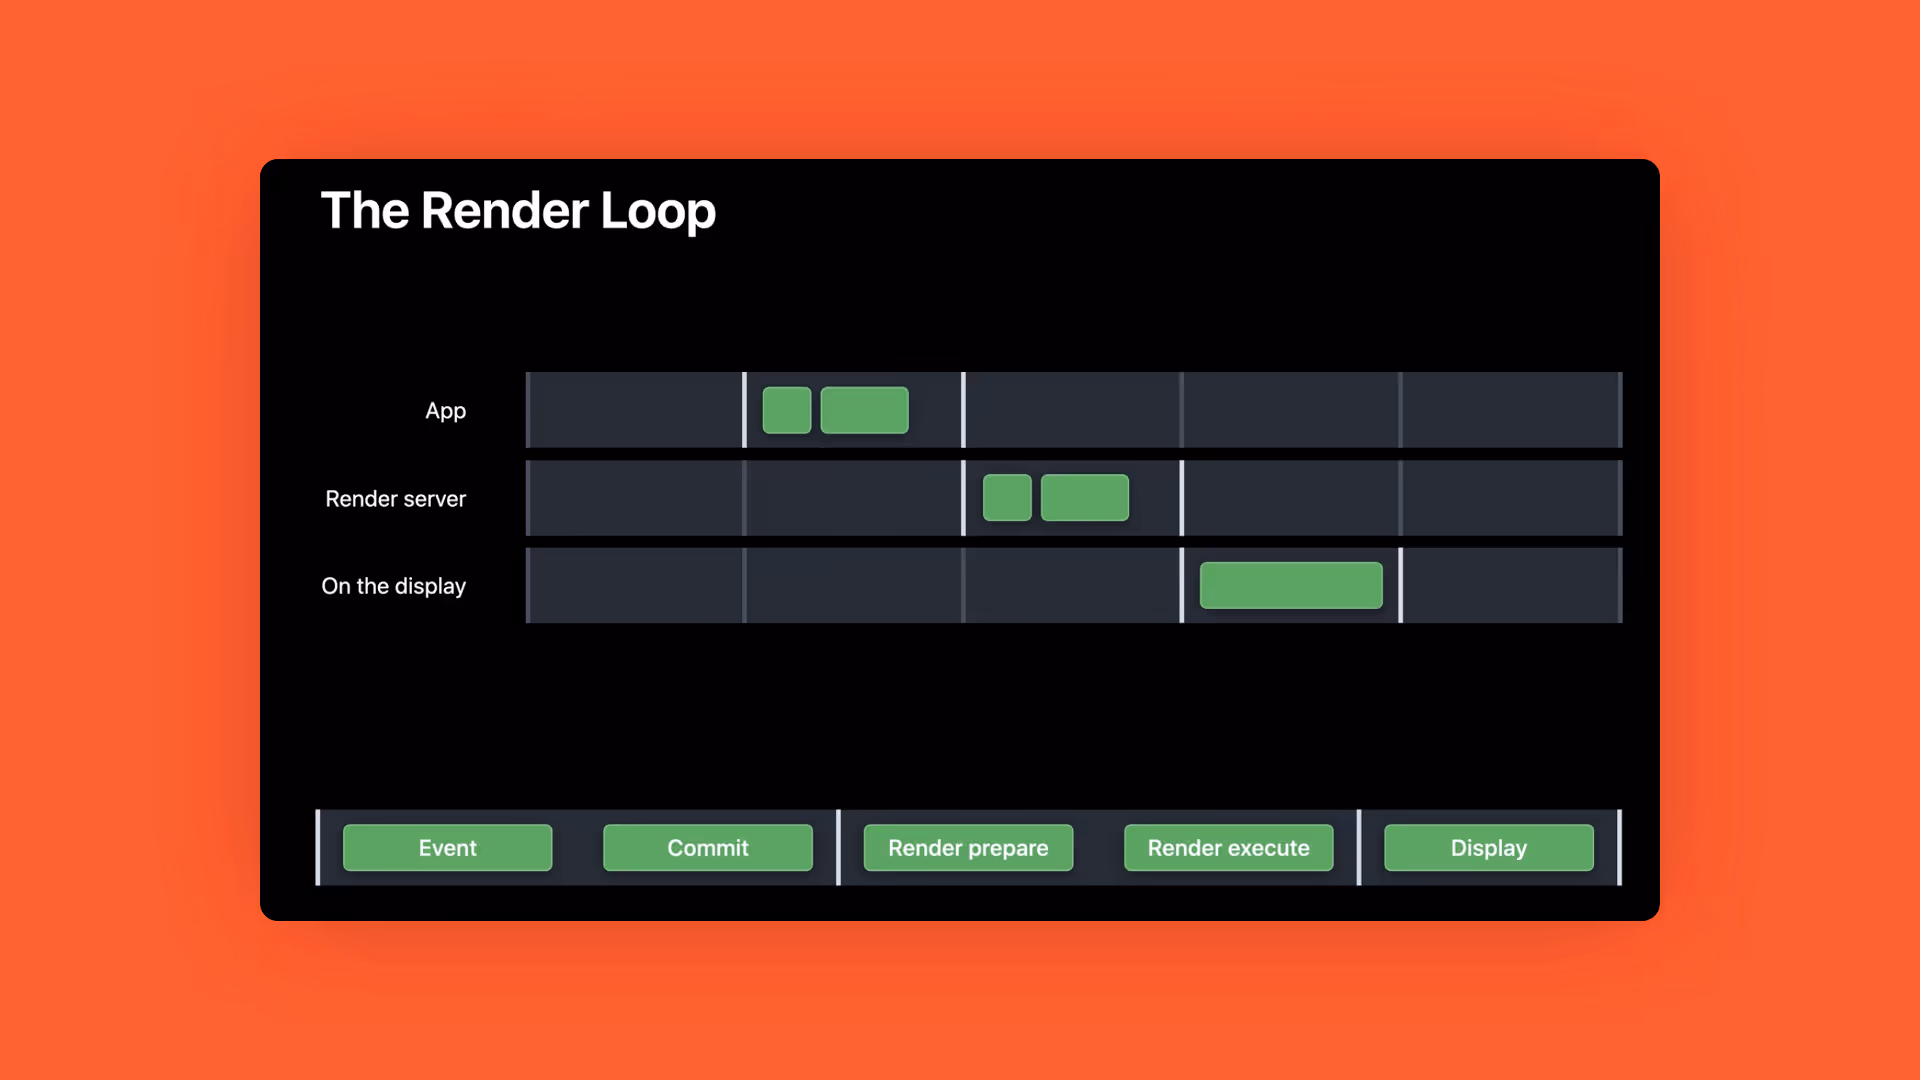
The Render Loop is the process to handle and display changes from our apps. It's composed of three steps: the App, the Render Server, and the On Display.
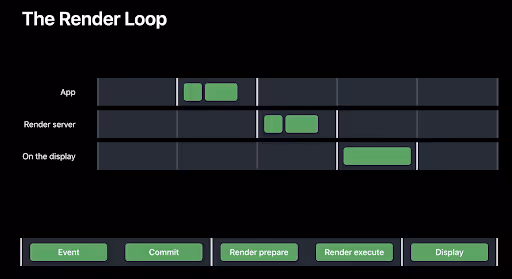
- The App step is separated in two phases: the Event phase, which is responsible for handling user touches or reacts to programmatic events. These then pass to the Commit phase where it makes the changes necessary to the UI to react accordingly. The Commit phase is where we execute all the code that will make the UI change, like updating views positions, changing an UIView background color, or setting an UILabel text.
- After the App step, the Render Server step kicks in, which is also split into two phases. First is the Prepare phase which processes the hierarchy of changes required to all the layers in the screen. Then it can finally pass to the Execute phase, where the GPU actually draws the layers, forming the final frame to be displayed.
- After the Execute phase with the final frame formed, it can then be On Display to the user.
All the work in the first two steps should be done before the next frame pass. This means in under 16 ms, or 8 ms for devices with ProMotion displays in order to keep the experience fluid at 60 and 120 frames per second (FPS), respectively. Everytime a step takes more than a frame pass to execute, we take a hitch, meaning we deliver the next frame later than it was expected. This causes a dropped frame, repeating the current on display frame, which affects the user experience by making it less fluid.
To fight hitches, it is necessary to look at many key points that make the logic to compose, render, and handle the UI in our apps. Specifically, we revisit the approach taken for the Search Results screen, how we build our Layout, and how we handle Images and leverage Multithreading. All of these topics will be discussed in subsequent blog posts.
To better understand what's happening and check for the results for any changes we do in our screen (and the rest of the app), we should profile it by using Instruments with a real device set in Release mode for accurate results. This is a useful way to validate points we will explore. Here we are using an iPhone Xr with iOS 14.3, and will run the exact same flow every time we do a change: opening the Search Results screen, scrolling to the fiftieth item, and scrolling back to the top.
First, on Xcode we select Profile in the Product menu or just press CMD + I. It will build the App for profiling, install it on the device and open Instruments.

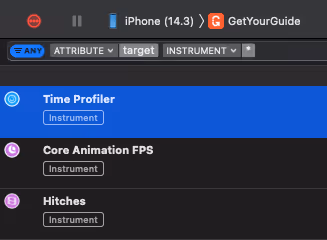
For this series we will use the Time Profiler template, remove the Points of Interest and Thermal State instruments by selecting them and pressing backspace, and use the + on the top right corner to add Core Animation FPS and HItches. I also encourage using Core Animation Commits and Advanced Graphics Statistics for a more in-depth look, but we won't cover it here.

In the end we should be looking at something like this:
Now that our environment is ready, we can continue. In the next three posts, I'll discuss ways to save on elements that are expensive in terms of computational power – such as images and multithreading – in order to boost runtime performance. I'll also touch on how to improve networking.
Next in the series is layout, and why any app screen is essentially a bunch of layers.
Stay tuned!

More articles like this