Revolutionizing the Experience Marketplace: The dual impact of Generative AI on Suppliers and Consumers
Discover how GetYourGuide is revolutionizing the travel experience marketplace with Generative AI! Dive into the dual impact of AI on suppliers and consumers, enhancing activity creation efficiency and content quality. Learn from our journey of integrating AI into product features, overcoming challenges, and achieving success with a unique experimentation framework. Uncover insights on how AI-assisted onboarding boosts completion rates and activity performance, supported by collaborative communication and data-driven strategies. Join us in transforming the experience industry with cutting-edge technology and innovation.


Key takeaways:
As a leading travel marketplace, the continuous creation of new activities is pivotal for us to ensure that we offer a wide variety of experiences for our travelers. To set up our activity providers for success, we continuously focus on making this activity creation process as seamless and efficient as possible, all while maintaining high standards of content quality. This has carryover effects on the demand side of our marketplace, as travelers interact and engage directly with the activities our activity providers create.
In this two-part article series, we share key learnings and challenges that come from launching a Gen AI product feature that can significantly impact both the demand and supply sides of a business.
- This first part will be of interest to all readers curious to know about what goes into integrating a Gen-AI solution into a product. The learnings we share can be applied across different projects and across different businesses, and will be especially useful when integrating Gen AI into product features that impact virtually all participants in online marketplaces.
- The second part will cover how we developed a permutation testing framework and toolkit that was crucial for us in measuring the success of our product features.
These highly impactful features are usually a product of multiple teams working together over an extended period of time. We will discuss broadly about how having perseverance in your convictions, being data-driven, and effectively communicating and collaborating can turn curveballs into big wins.
{{divider}}
Our use case for a Gen-AI feature
Our activity onboarding process involves going through a 16-step product creation wizard where activity providers add various information such as descriptions, photos, availability, pricing, and locations. Based on feedback and research done on the experiences of activity providers, we learnt that this process was long and arduous - activity providers were sometimes spending up to an hour manually creating a new product with our wizard.
Additionally, while we provide instructions, tips, and examples, the content our activity providers create can contain missing or contradictory information and might not always have our traveler-friendly tone of voice. This leads to traveler confusion, negatively impacting conversion rates for new products, and a high ratio of travelers needing to contact our care department to clarify information before making a booking.
We strongly believed that introducing generative AI into this product creation process would not only speed it up and make it easier for activity providers but also enhance content quality by generating engaging, user-friendly descriptions. This would ensure consistency across experiences and lead to more trust from customers.

Today, our full-scale rollout of the feature enables activity providers to paste their existing content (such as from their own website) into a designated input box. We then do some AI magic to generate both the longer free-text content sections, like the full description, as well as fill out many of the structured fields, like what kind of transport is used and what locations should be tagged. With AI, product onboarding becomes faster and more accurate. The AI auto-completes 8 key steps, allowing activity providers to review content in minutes, reducing time spent on manual data entry.
Reaching this stage wasn't straightforward; it involved overcoming significant challenges along the way. So, how did we transition from the ideation stage to a failed experiment, and ultimately to a successful full-scale rollout?
The challenges
This was a complex cross-functional project that spanned over multiple quarters and involved contributors from several teams: the new Supply Data Products team, which did the heavy lifting for setting up the AI model; the catalog tech team, responsible for our product inventory infrastructure, the content management team, responsible for overseeing the content quality of our inventory and the Analytics team, responsible for setting up the experiment and measuring its success.
One of these challenges was evaluating the experiment’s success. While we have a very proficient in-house experimentation platform, its functionalities were not fully accessible for experiments done on activity providers and while we consistently do tests on our activity providers, this was the largest test in terms of both its impact and scope. This meant our primarily traveler-focused AB experimentation framework could not easily be relied upon. Even though activity providers were exposed to A vs. B variants, travellers couldn't be separately assigned to these variants. After all, a product created through AI could not also have a non-AI created version (since that is not what the supplier opted for when creating the product).
Additionally, evaluating AI outputs is challenging because these systems often act as black boxes, making it hard to discern how decisions are made and what to tweak for the final product. The correctness and suitability of AI-generated results depend on factors like input data quality and algorithm design. While outputs may be technically correct, they might not meet what our platform could support. One common pitfall is scope creep—underestimating the limitations of AI and over-promising what AI can realistically achieve in the marketplace. It’s crucial to balance ambitious goals with practical constraints. The scope must be adaptable to rapid advancements yet precise enough to guide development effectively.
Faced with these challenges, we dotted the i’s, crossed the t’s and then launched our first full-scale experiment.
The Curveball
For our first experiment, 75% of our user base was assigned to the treatment group, where they could opt to use the AI feature, whilst the other 25% would form our control group and would not be exposed to the feature. We chose a larger base to be in our treatment group, as there was an opt-in scenario. Activity providers could still choose not to use the feature. We knew from smaller tests done previously that the adoption rate would be around 60% for the AI feature, meaning that 60% of the exposed 75% would result in around 50% of activities being created via AI.
In the early days of the experiment, we noticed that our primary success metric, which measures the percentage of activities that get submitted out of the ones that start the product creation wizard, was significantly lower than expected. Our treatment group lagged behind the control group.
A significant pitfall during AI feature launches is user confusion and a lack of trust. In our case, activity providers didn’t understand how the AI tool fit into the onboarding process, leading to higher drop-off rates and confusion about how the AI feature worked.
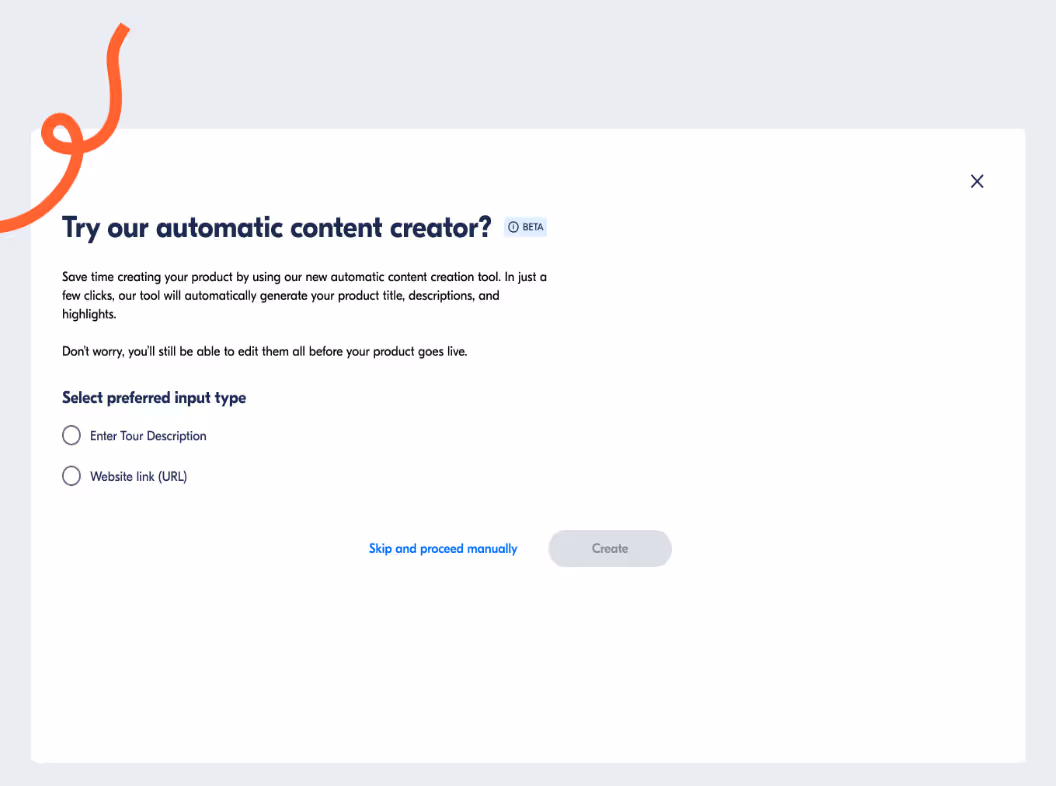
Above, you can see a screenshot of the page where activity providers started this AI-assisted process. They would start creating an activity, land on this page, and then think they were in the wrong place. So they would go to create a new activity again. We realized that the UI didn’t really explain what the automatic content creator was or what it was helping them do.
Our second finding was that activity providers in the treatment group were spending longer on the pages that were not filled out by AI. We learned that these users were frustrated about having to fill out some of the pages manually. Different prompts for different experiences impacted the way activity providers behaved during the activity creation process.
Lastly, we encountered a measurement problem. Our planned standard A/B experiment analysis approach would not hold under the given circumstances. We learned that our experiment groups A and B showed significant differences in both traveler — and supplier-side metrics, even when we analyzed them before the experiment. Some activity providers could significantly skew the results towards A or B based on where these activity providers were assigned. This meant that we had to think of a different approach to analyzing the success of the experiment.
With our primary success metric showing a decrease, we closed the experiment to A and did not launch the feature. We collected what we had learned, went back to the drawing board, and decided to conduct a second test.
The Win
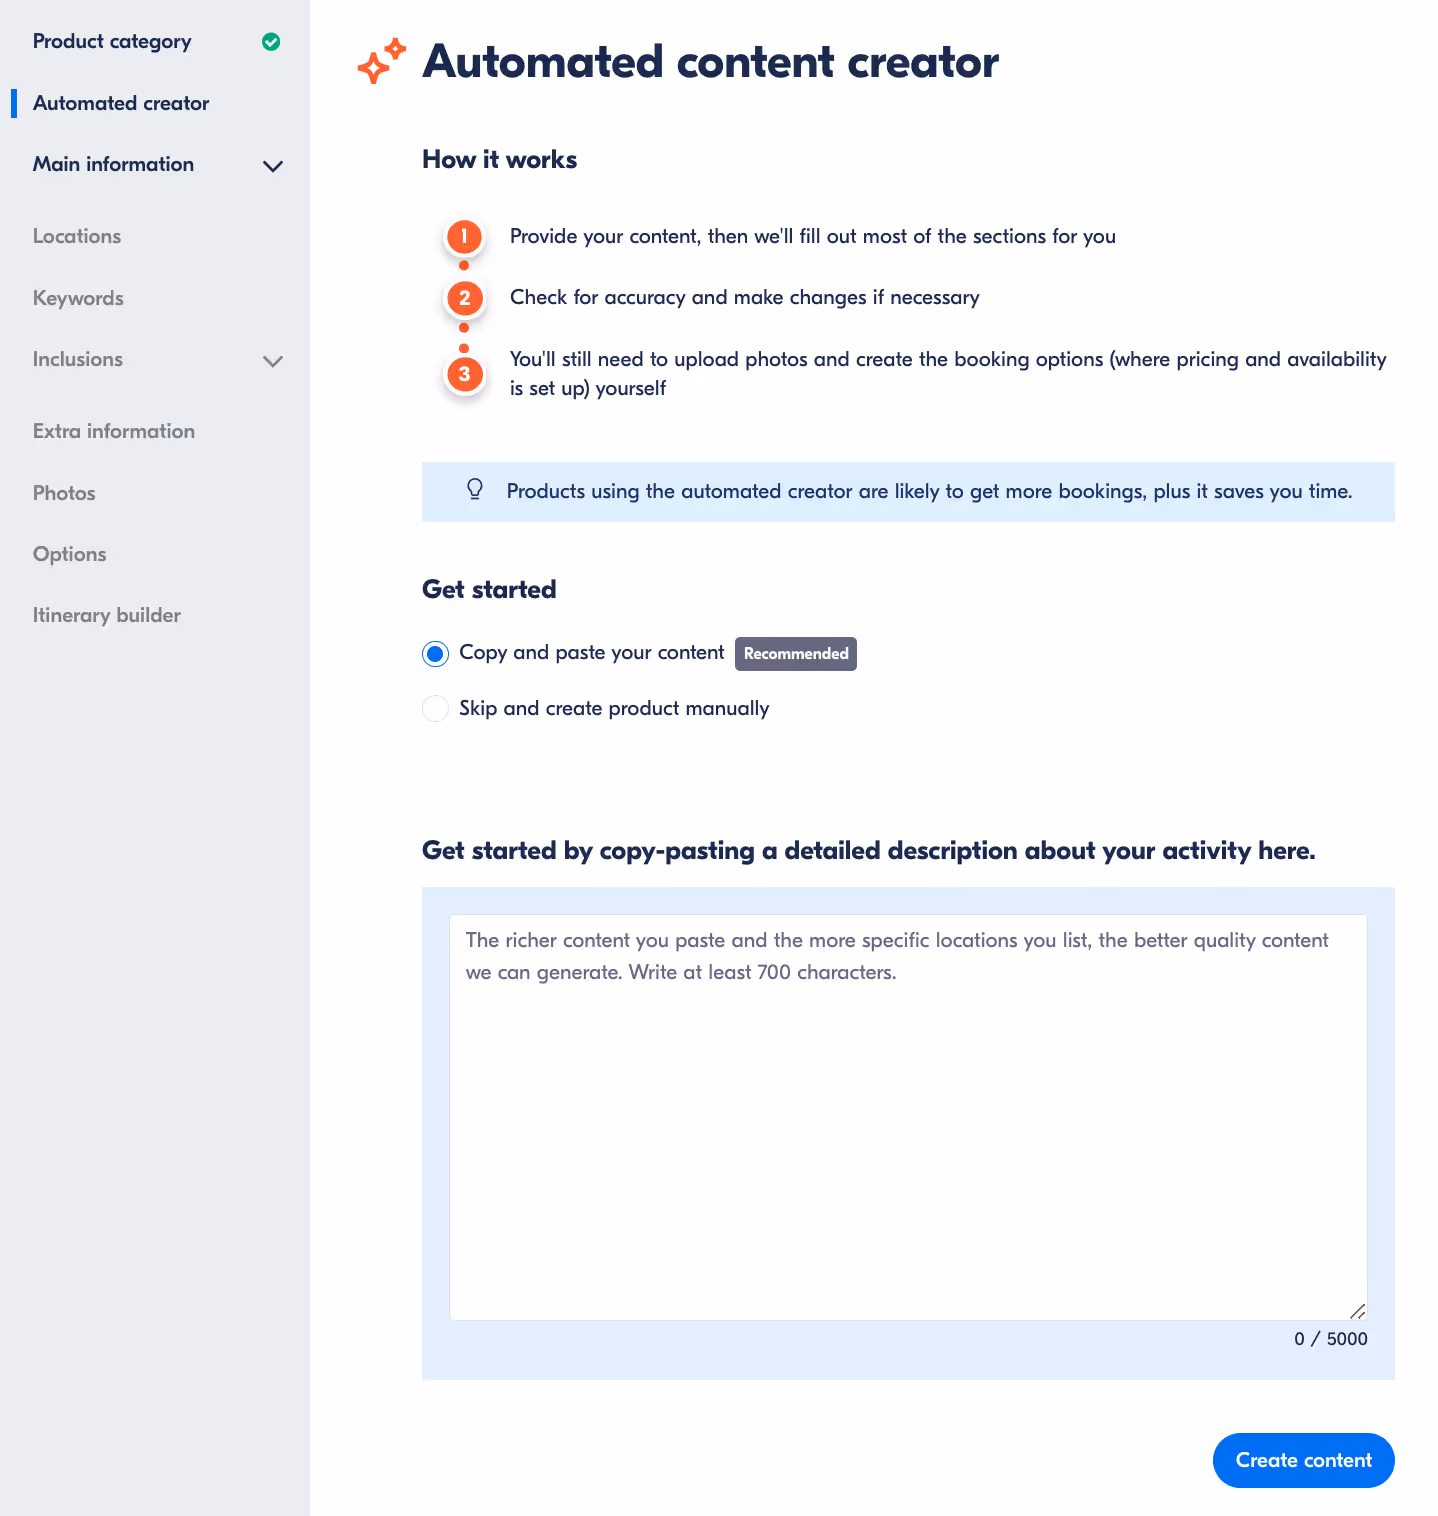
Ahead of the second test, we made a few UX improvements based on our learnings. We clarified that the AI page was a step within the normal product creation wizard, with the left-side menu/progress bar visible. This guaranteed that activity providers knew they were in the right place. We also improved the visual design and microcopy of the AI input page to better set expectations about how the tool works and what it would and wouldn’t do. We also refined the LLM to improve the content quality and to automatically fill out more sections.
The UI improvements reduced user drop-off from the AI input page to the following page in product creation by 5 percentage points (tackling the high bounce rate we described earlier). Users also had similar times spent on non-AI-assisted pages of product creation, so the time on these manual pages was decreased from the first experiment (due to users having been informed what was coming and knowing what they would have to do themselves).
We also validated the success of the AI tool with qualitative feedback via Hotjar surveys. One supplier quoted “it was very very convenient to use and very helpful… it was my first time posting an ad and it went by with a breeze. Thank you for this”. We found instances where supply partners progressed through the product creation process in just 14 minutes from start to finish.
A significant achievement also came in the form of building an experimentation framework that allowed us to measure both the supply side and the demand-side impact of the tool. This framework accounted for potential skew introduced by certain activity providers and recognized that our metrics were not directly comparable even before the experiment began (i.e., our metrics were not similar for A vs B even before the experiment, which meant any uplifts during the experiment would be hard to attribute to the feature itself).
The end result of our efforts was an increase in all our success metrics. By assisting activity onboarding, activity providers were more likely to complete onboarding for their activities, and the higher quality content meant we saw a solid increase in activity performance for activities onboarded through AI. We closed the experiment and launched the feature to 100% of our user base.
What led to our success
In the interest of keeping this reading brief, we made several omissions in the events that happened during both tests in terms of how the project developed and the countless decisions we had to make. However, our key learnings from this multi-quarter feature launch that impacted both the supply and demand side of the market, whilst involving 4 collaborating teams, are summarized below:
- Have perseverance in your convictions: Failure (or sometimes multiple failures) is often a part of the learning process. These failures don’t necessarily mean the idea isn't viable. Instead, understanding why we failed and what we learned means we can turn things around. Our belief in the potential of AI-assisted content creation drove us to iterate and improve rather than abandon the project, ultimately leading to its success.
- Being data-driven is key: Adopting a data-driven approach was essential for our experiment's success. We closely monitored metrics for both travelers and activity providers, ensuring a thorough understanding of the impact the feature had on our marketplace. By analyzing each step our activity providers took, we gained valuable insights into how they interacted with the feature and how it impacted their behavior. We segmented this data by key dimensions to identify and understand who was engaging and who was struggling. This process involved asking critical questions and consulting with analysts to select the most pertinent metrics. Through this detailed examination, we were able to refine our strategies and eventually succeed.
- Collaborative communication is essential: Regular bi-weekly syncs, active Slack channels, and ad-hoc meetings enabled seamless collaboration across four teams. This structured yet flexible approach to collaboration was essential for navigating the project's complexity. We also maintained open channels for immediate feedback. This allowed us to quickly identify and address challenges in our collaboration. This rapid feedback loop helped us continuously refine our ways of working to better serve the project's goals.
- Central knowledge repositories and singular source of truth databases are crucial: For complex, multi-quarter projects, having a single source of documentation is essential. We created and maintained a centralized master file with all important links in one place, which proved invaluable for keeping everyone aligned and informed (this document alone referenced 30+ other singular documents). Additionally, having a unified approach to data analysis is critical when working with multiple teams and complex metrics. Creating a “master table” and documenting all assumptions and logic helped us avoid confusion and ensure all decisions were based on consistent, reliable data.
- Early analytics involvement for new product features can make a difference: Including analysts from the project's inception, even before their immediate expertise is needed, ensures better context and more meaningful insights. Their early involvement helped shape our approach to measurement and led to more robust analysis of results.
- Expect the unexpected and pay meticulous attention to detail: In complex projects, leave no stone unturned, thoroughly investigate why failures occur, and meticulously measure and understand user behavior, as these insights can significantly influence the experiment's success. Anticipate potential setbacks and plan extensively for various scenarios, ensuring you're prepared for any unexpected developments.
- Outliers are insightful: What might appear as statistical anomalies often highlight important user patterns and pain points. In our experiment, these outlier cases proved instrumental in refining our product for the second test.
- Expectation setting shapes user behavior: Clear UI copy that outlines both the benefits and limitations of AI tools is crucial for user engagement. We learned that transparency about what the tool can and cannot do significantly improved user satisfaction and adoption.
- Anticipating potential issues before they arise and setting up monitoring systems to track them is crucial. This forward-thinking approach allowed us to address challenges quickly and minimize their impact on the project’s success.
Conclusion
While AI has undoubtedly been the talk of the town in recent days, integrating it into a product is far from straightforward. It requires meticulous planning, a data-driven approach, streamlined cross-functional collaboration, and a willingness to embrace complexity and overcome hurdles. We hope that the insights and learnings shared here prove valuable to readers in their own endeavors.
Special thanks to Agus for being our sparring partner, and Raslam and Konrad for reviewing this article.
Want to help us revolutionize the experience industry? Check out our open roles and join our journey.

More articles like this