Beyond Parametric Tests: The Power of Permutation Testing
Discover how permutation testing helped us overcome the limitations of traditional Z-tests in real-world A/B experiments—and how we built internal tools to scale its use for measuring Gen-AI impact on both creators and travelers at GetYourGuide.

Data Analyst

Key takeaways:
In our last article, we talked about the challenges we faced and the key lessons learnt when launching a Generative AI (Gen-AI) solution at scale. In this post, we’ll discuss a statistical method that was particularly useful for measuring the impact of our experiment. We explain the circumstances that led us to rely on this methodology and how powerful and widely applicable this technique is. Lastly, we’ll summarize our learnings and talk about best practices when tackling tricky analytical challenges.
These insights will prove useful to readers who encounter tricky analytical challenges, want to find solutions, and aim to go the extra mile to ensure their innovative work doesn’t end up as a one-off endeavour.
When can Z-tests fail?
A large percentage of A/B tests focus on measuring how well users convert when exposed to a treatment variant (commonly known as B) and a control variant (commonly known as A). This conversion rate is often measured as a percentage of users taking a certain action as a proportion of all users exposed to the variant. A Z-test of proportions is then applied to validate whether the observed difference between variants A and B is statistically significant.
However, this methodology is based on a set of assumptions that can easily be violated in real-life situations. Failure to meet these assumptions can invalidate any result we obtain.
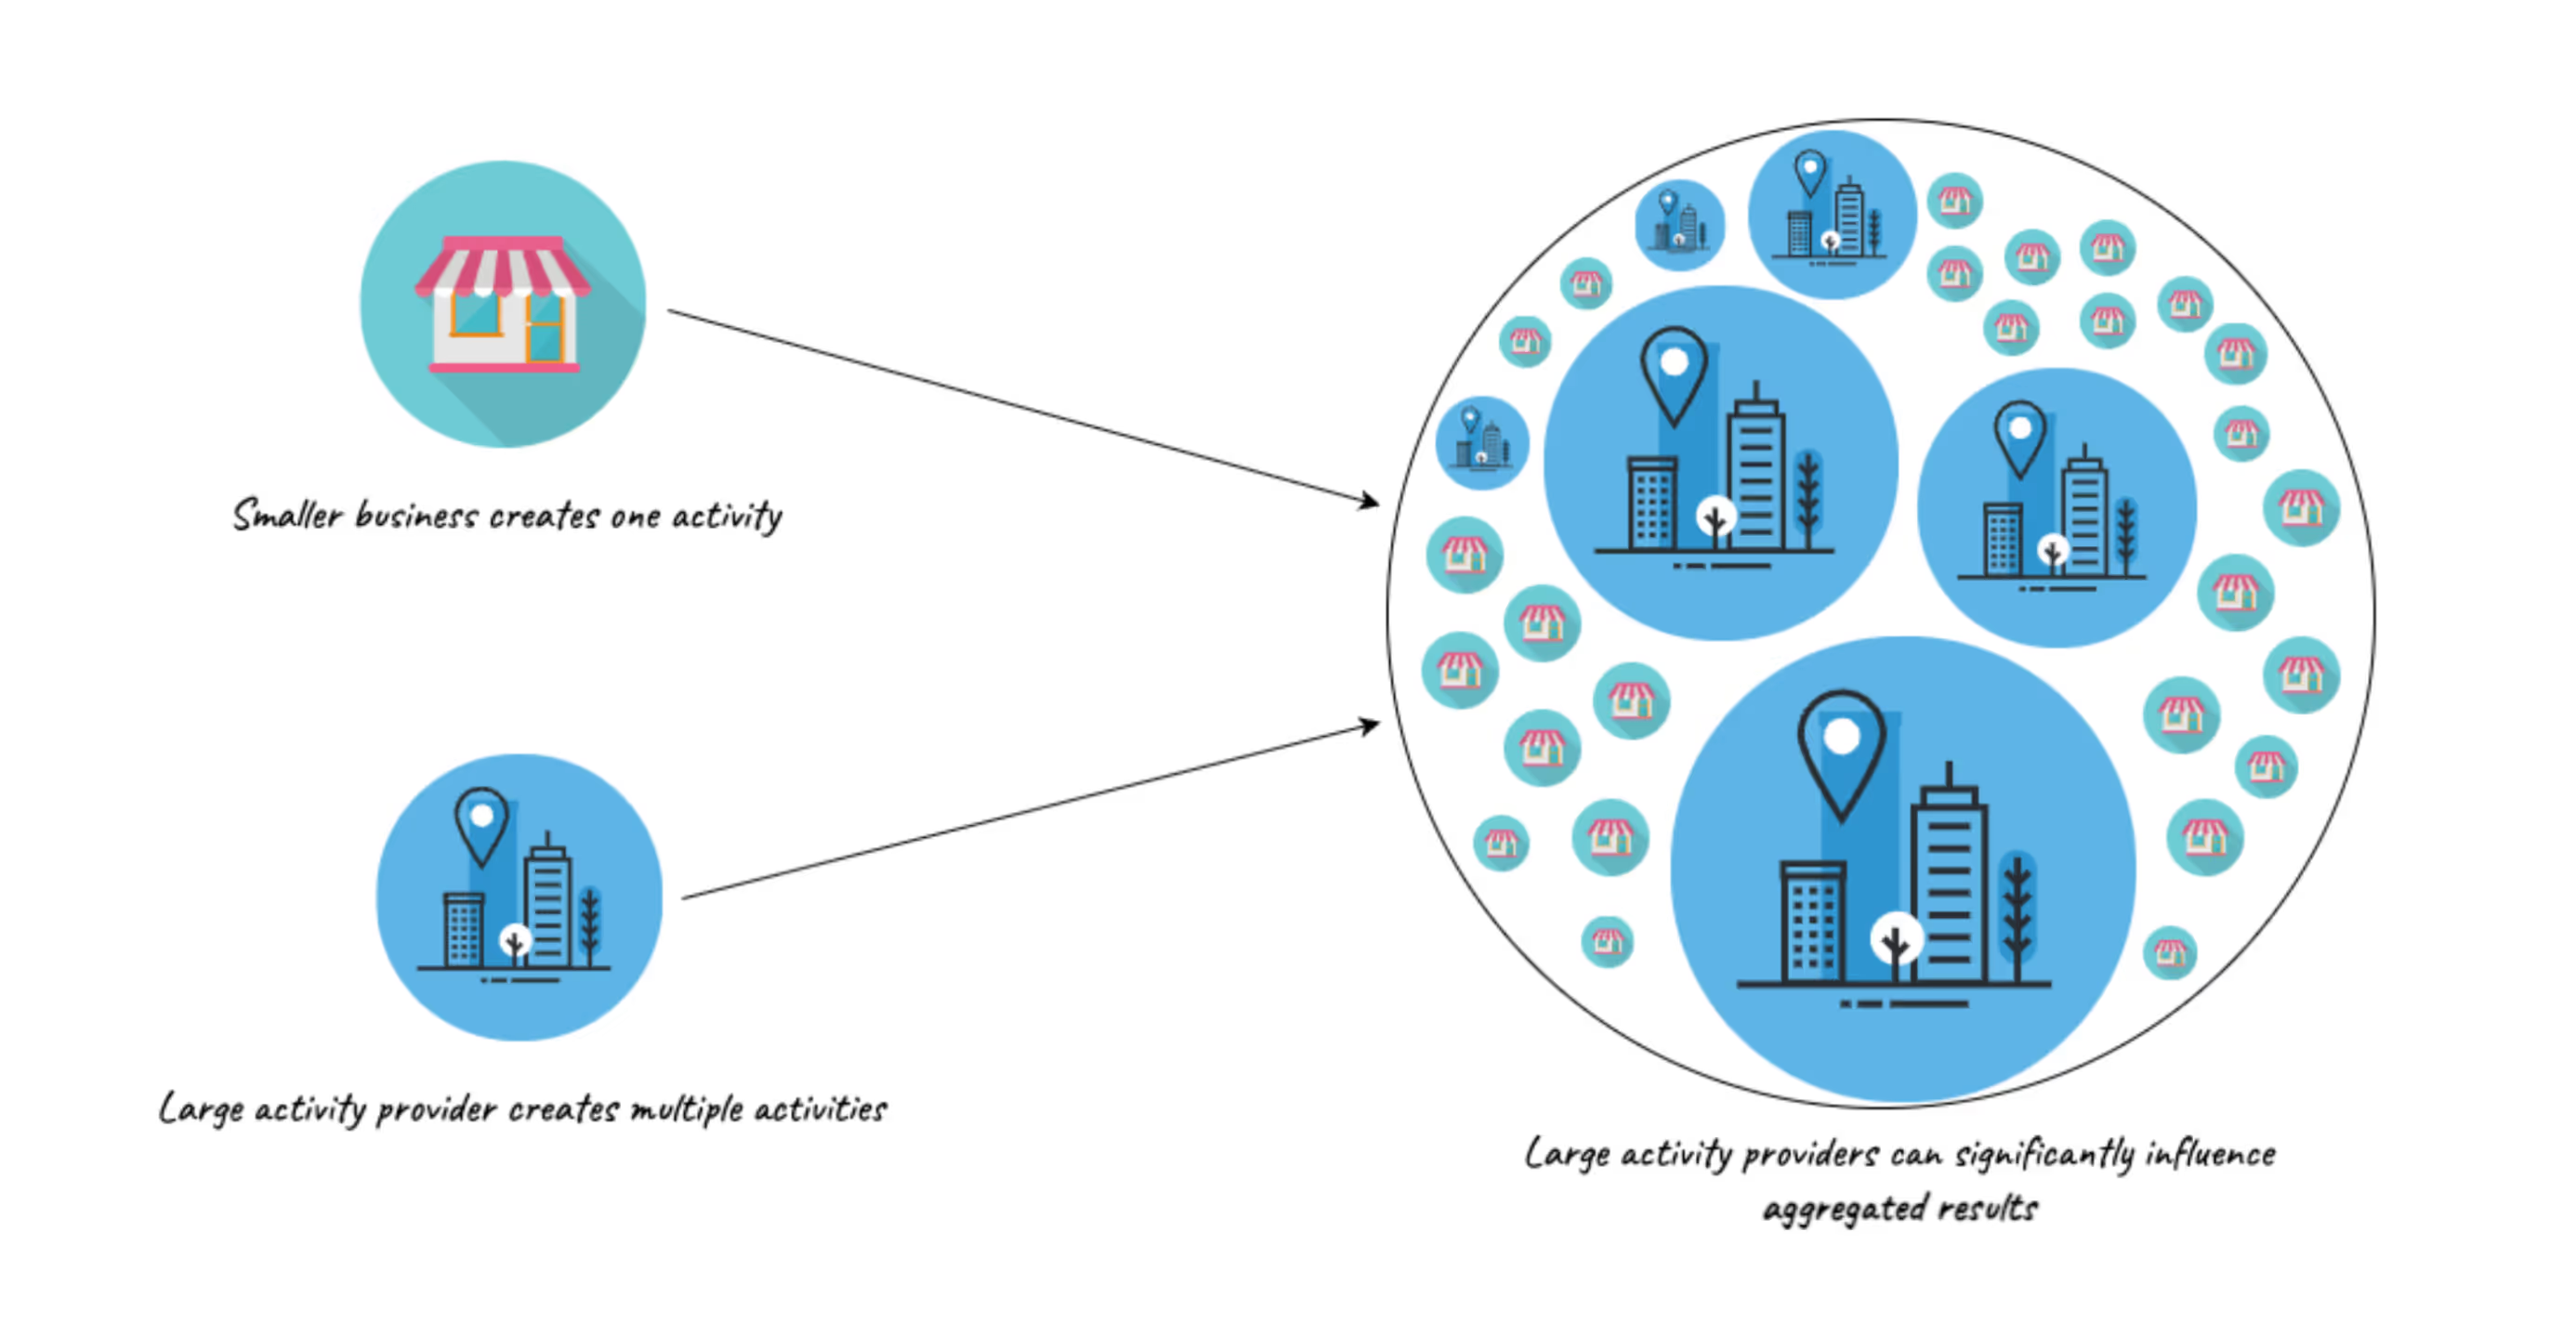
One of the ways this can occur, which we also encountered when launching our Gen-AI feature, is when our randomization unit differs from our analysis unit. This means that the “success” of each unit/user isn’t a single outcome. Rather, it can differ based on each observation we record for a specific unit. This also means that certain units (i.e., users) can have a much higher impact on the overall outcome of the experiment and can also single-handedly sway results towards A or B.
Even evaluating the result of an experiment based on the session-level, and using click-through rates violates a very important assumption. Multiple sessions can come from the same user, and thus our observations are no longer i.i.d variables. Additionally, this can result in an underestimation of variance, which in turn can give us a higher Z score and hence a higher likelihood of falsely rejecting the null hypothesis (you can read more about this phenomenon here). We thus need to explore alternative methods to analyze the impact of the experiment.
Our measurement challenge
During the launch of our AI content creator experiment, we faced a similar issue. Our primary metric of interest was Activity Submission Conversion Rate, which measured how likely an activity provider was to complete submitting an activity after they started creating it. Similar to our session click-through rate example above, this was a case where our analysis unit did not match our randomization unit.
Additionally, we wanted to measure the success of our feature on travellers. One of our core hypotheses was that AI would assist activity providers in creating better-quality content, which would lead to improved performance for travellers as well. Measuring this was particularly tricky — we were running the experiment by randomizing assignments for activity providers, but we wanted to measure the impact on travelers, too.
Because these activities were new, we couldn’t compare their current performance with past results to see how AI helped boost performance. Setting up an experiment where travelers could see a non-AI-generated version of an activity vs an AI-generated version was also not possible. Additionally, we also couldn’t split activity providers into variants in a way that guaranteed similar performance in terms of traveler metrics, because we had no guarantee that these activity providers would create new activities during the experiment or that their new activities would even be reflective of or similar to their previously created activities. Therefore, predicting an activity’s performance as soon as it goes online is highly complex.
Thus, we had to navigate through two tricky measurement problems, one being measuring activity submission CR based on activity provider level randomization, and the other involved measuring traveler performance for activities that had just gone live.
What is Permutation Testing (and how it fixed our problem)?
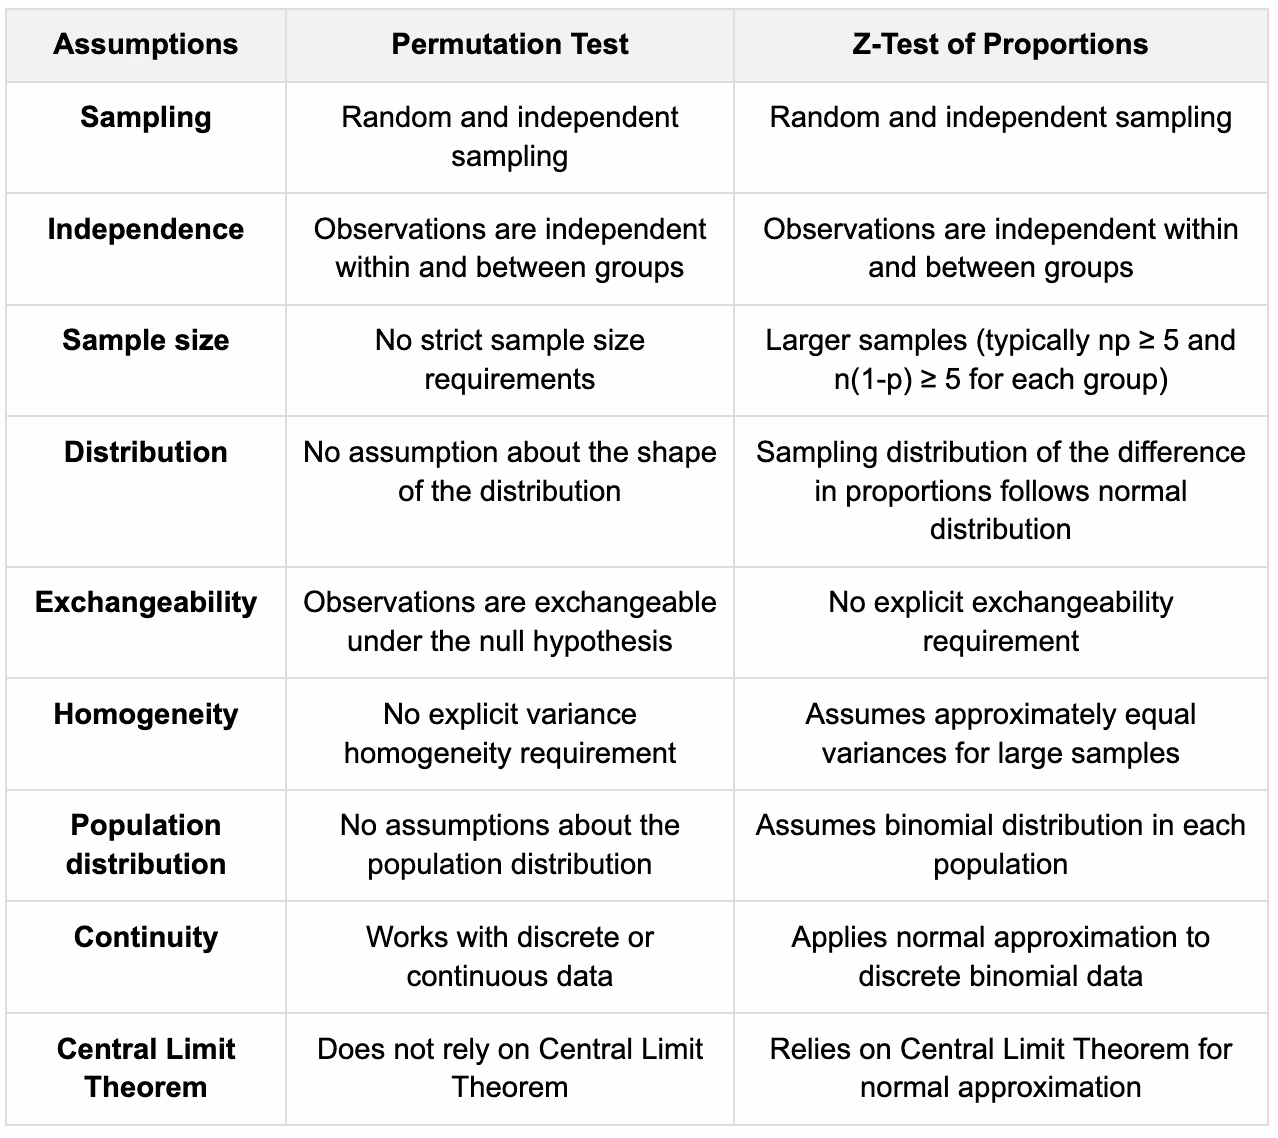
Permutation testing is a non-parametric statistical method used to determine the significance of an observed result i.e. an experiment in our use case. Unlike a z-test that relies on multiple assumptions, permutation testing makes very few assumptions. It allows for testing hypotheses without assuming normality or homogeneity of variance, making it particularly useful when those assumptions can be violated. In the table below, we can see what assumptions are required for each test.
The permutation test primarily works by creating a null distribution of our test statistic by repeatedly shuffling or permuting the data and then recalculating the test statistic. Then, by comparing the observed test statistic to the distribution of permuted statistics, we can determine the probability of obtaining the observed result by chance alone. This article provides a very nice illustration of how it works.
This method also works very well in calculating traveler metrics for the AI content creator A/B test. We evaluate whether the observed differences for our set of metrics are significant enough to be likely caused by experimental manipulation rather than random variation.
Some additional considerations when running a permutation test include:
- Number of permutations: This defines how many times the data will be shuffled to simulate the null distribution. The test can be computationally expensive, so these can significantly impact calculation times.
- A confidence interval: do we want to bootstrap one for our test statistic?
- A significance level: This is similar to other statistical tests.
- Store the results: This is good practice so that they can be analyzed further or reused later.
Lastly, the labels should be shuffled on the same level as in the original experiment. For example, if our test statistic involves calculating a session-level metric, but our randomization was done on a user level, the labels should be shuffled on a user level (and not the session level).
Building Tooling and Encouraging Adoption
At GetYourGuide, in addition to our experimentation platform, we have an expansive internal Python library and Databricks notebooks that support analysts in a wide variety of analyses. After the conclusion of the experiment, we decided to expand our tooling to include permutation testing. This meant that anyone at GetYourGuide could now use these tools to both analyze and visualize the results of A/B experiments based on permutation tests. This not only allowed users to evaluate custom metrics for specific experiments, but also made it possible to compute pre-defined statistics for common use cases. For example, activity performance is a commonly used metric and this could now be evaluated just based on a list of activity IDs and the variants in which they lie.
This makes running permutation tests as easy as writing two lines of code. We also added detailed documentation on how the test could be run, what runtimes could be expected (since specifying longer iterations can significantly impact run times), and the ability to save computationally expensive results by simply specifying the name of a table they should be stored in.
In addition to building a capable and easy-to-use tool, we also discussed the specific problem we faced and how we solved it using permutation tests in multiple meetings and forums in the analytics organization. This included department-wide learning sessions as well as wider forums like our Tech All Hands. Doing this garnered interest and pushed adoption.
Lastly, sharing solid examples and success stories about how the new approach (and its accompanying tooling) could solve other challenges helps analysts to understand its value, motivating them to use it.
Key Takeaways
In this blog post, we discussed the limitations of traditional Z-tests in analyzing A/B experiments, particularly when certain assumptions are violated. We then highlighted a common situation where the randomization units can differ from the analysis unit and how this can lead to invalid results. We then introduced permutation testing as an alternative statistical method that requires fewer assumptions and is more robust in such scenarios. We learnt how:
- Parametric tests can fail in real-world situations: Traditional methods like Z-tests can fail in real-world situations when assumptions such as independence of observations or homogeneity of variance are violated. In such situations, especially where using proxy metrics is often not desirable, permutation testing is a solid alternative.
- Permutation testing is an intuitive and statistically sound alternative for measurement: This non-parametric method is lightweight on assumptions, making it particularly useful when the requirements of other commonly used parametric tests cannot be met.
- Building tooling around new approaches ensures your effort is not lost as a one-off endeavor: Analysts often solve unique problems using new or innovative methods, but these approaches can become one-off efforts unless knowledge is shared or easy-to-use tooling is built around them. By creating accessible tools and documentation, you can ensure that your work is easier for others to adopt, compounding the value of your initial effort and driving broader impact across the organization.
- Going the extra mile to drive adoption can compound benefits: Building tooling is often not enough - ensuring adoption of new methodologies requires clear communication of benefits, accessible training resources, and showcasing success stories. By fostering collaboration, providing hands-on examples, and integrating tools seamlessly into existing analytical workflows, analysts are more likely to embrace innovative approaches.
- Lastly, stay curious: Permutation testing is not a widely known or used approach compared to traditional statistical methods. It is often missing from statistical study resources and cheat sheets, and many analysts might not even realize or know of its potential. By staying curious, exploring lesser-known techniques, and investing time in research, analysts can uncover powerful tools that significantly enhance their approach to problem-solving.
We hope that these insights and learnings prove valuable to you in your own endeavors and help you to maximize the impact of your work.
Special thanks to Agus for being our sparring partner and Raslam for reviewing this article.
Interested in a pioneering career at the forefront of travel and tech? Check out our open roles.

More articles like this