How we Standardized Machine Learning Observability Across Teams
Machine learning is an intrinsic tool behind GetYourGuide’s platform. To harness its power, being able to measure, monitor, and analyze its production is essential. Here, Mihail Douhaniaris and Steven Mi explain how the team boosted observability using Arize.
Careers Team

Key takeaways:
Machine learning is an intrinsic tool behind GetYourGuide’s platform. To harness its power, being able to measure, monitor, and analyze its production is essential. Here, Mihail Douhaniaris and Steven Mi explain how the team boosted observability using Arize.
GetYourGuide is a leading online marketplace for travel experiences, connecting travelers from all around the world with unforgettable experiences. Behind the scenes, our platform is powered by a variety of machine learning (ML) models that help make these connections possible. Whether it’s through recommender systems, supply and demand forecasting, or search relevance models, our team of data scientists, analysts, and MLOps engineers are constantly working on improving the performance and reliability of these models.
In this blog post, Mihail Douhaniaris, a Data Scientist, and Steven Mi, an MLOps engineer – both part of the Data Products organization at GetYourGuide – share their recent work on improving and standardizing our ML observability capabilities and practices across the organization.
What is Machine Learning Observability?
ML observability refers to the ability to monitor and understand the behavior of machine learning models in production. This includes tracking key metrics such as model performance and data drift, as well as being able to debug and diagnose issues with models.
By enabling teams to monitor and understand their models, ML observability helps to ensure that models are functioning as intended and enables teams to quickly detect and resolve issues that may arise. This, in turn, helps to improve model accuracy, reduce the risk of model bias, and minimize downtime for users. In short, ML observability is essential for the success and reliability of machine learning models in production.
Model Monitoring at GetYourGuide
At GetYourGuide, we currently have numerous machine learning systems in production handling billions of prediction calls a day. These models are deployed with our ML platform either as batch inference models via scheduled Databricks jobs or as real-time inference models packaged in BentoML services. Ultimately, the predictions produced by these systems end up in our data lake where they are available for further analysis and monitoring.
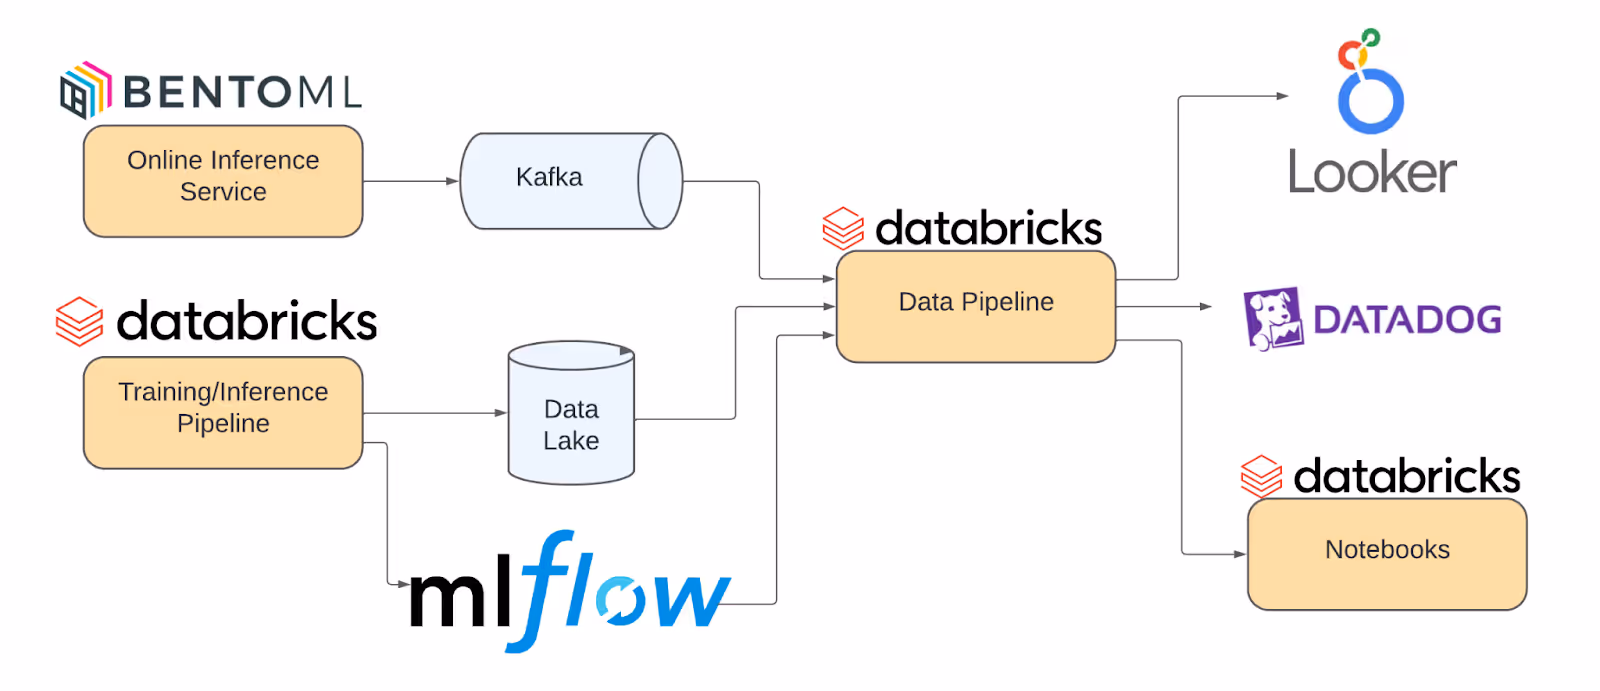
In one of our recent retrospectives, we identified ML observability as an area of improvement for our ML platform. A common pain point was that each project used a custom workflow around model monitoring. For some projects this meant maintaining a separate data pipeline computing various metrics and visualizing them either in Looker or Databricks dashboards, while other projects used Datadog for also monitoring real-time metrics. As we scaled our ML adoption, this lack of standardization meant emerging projects lacked observability, as pipelines were costly to set up. On top of that, maintaining these additional workflows and troubleshooting the models became increasingly difficult and time-consuming.
Due to the amount of manual effort required, the focus would often be on developing simple but important modeling metrics such as dataset shapes, share of missing values, number of predictions, as well as model performance metrics like accuracy and intersection over union. While these metrics are helpful for monitoring general machine learning model health, they may not be sufficient for identifying the actual root cause of a problem and they can often change rather slowly. We lacked standard support for metrics that would alert us of any potential issues before any dramatic drop in performance would occur in all data products.
Improving our Model Monitoring with an In-House Solution
It was evident that we could benefit from improving our ML observability capabilities and standardizing our practices around this topic, so we assembled a task force and started by documenting requirements for a future ML observability platform. Our new solution should:
- Enable us to better identify root causes of possible problems
- Provide an effortless way of setting up monitors for multiple features and models
- Be self-serviced, meaning data scientists can integrate and utilize the tool independently
- Integrate seamlessly with existing pipelines
- Support a wide range of machine learning models as we work on various problem types
- Support both batch and online inference
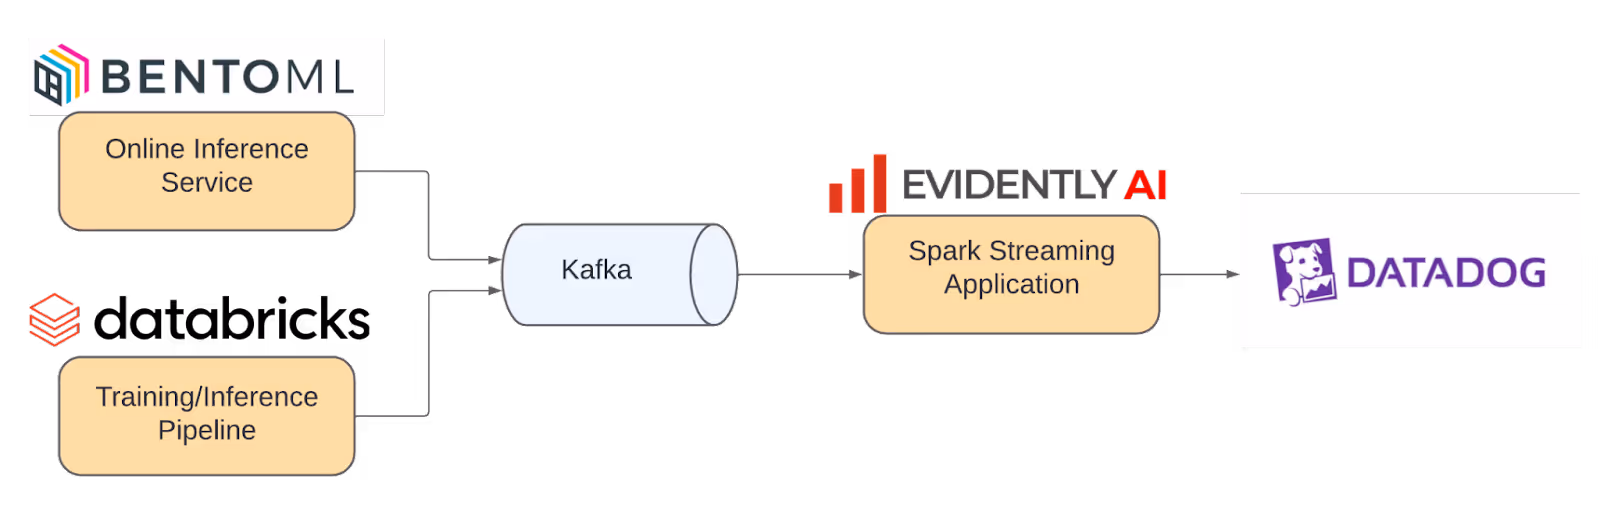
Since one of our data science principles is to use open-source libraries whenever possible and we’ve had good experiences with such libraries in the past, this was a natural starting point for this initiative. We reached out to the MLOps community for insight and guidance around the best practices in the industry and built an in-house observability platform MVP that leveraged a Python SDK to ingest data to Kafka, custom Spark Streaming pipelines to retrieve features and predictions from Kafka, and Evidently to compute data quality and drift metrics which were finally forwarded to Datadog.
While our in-house platform achieved better standardization of ML model monitoring across projects, it still came with a relatively high cost of maintenance in terms of time and resources. On top of that, developing an observability platform is not our core area of expertise. We quickly realized that an enterprise solution would meet our long-term monitoring needs.
Machine Learning Observability with Arize
As we looked for a better alternative to monitor our ML models, we explored various enterprise platforms available in the market. We met with a few different vendors to get an overview of their products, and after comparing functionality, scalability, and features, our team decided to build a proof-of-concept (POC) using Arize as it seemed to fit all our requirements for an ML observability platform including support for multiple data ingestion, model types, as well as automatic monitor and alert creation.
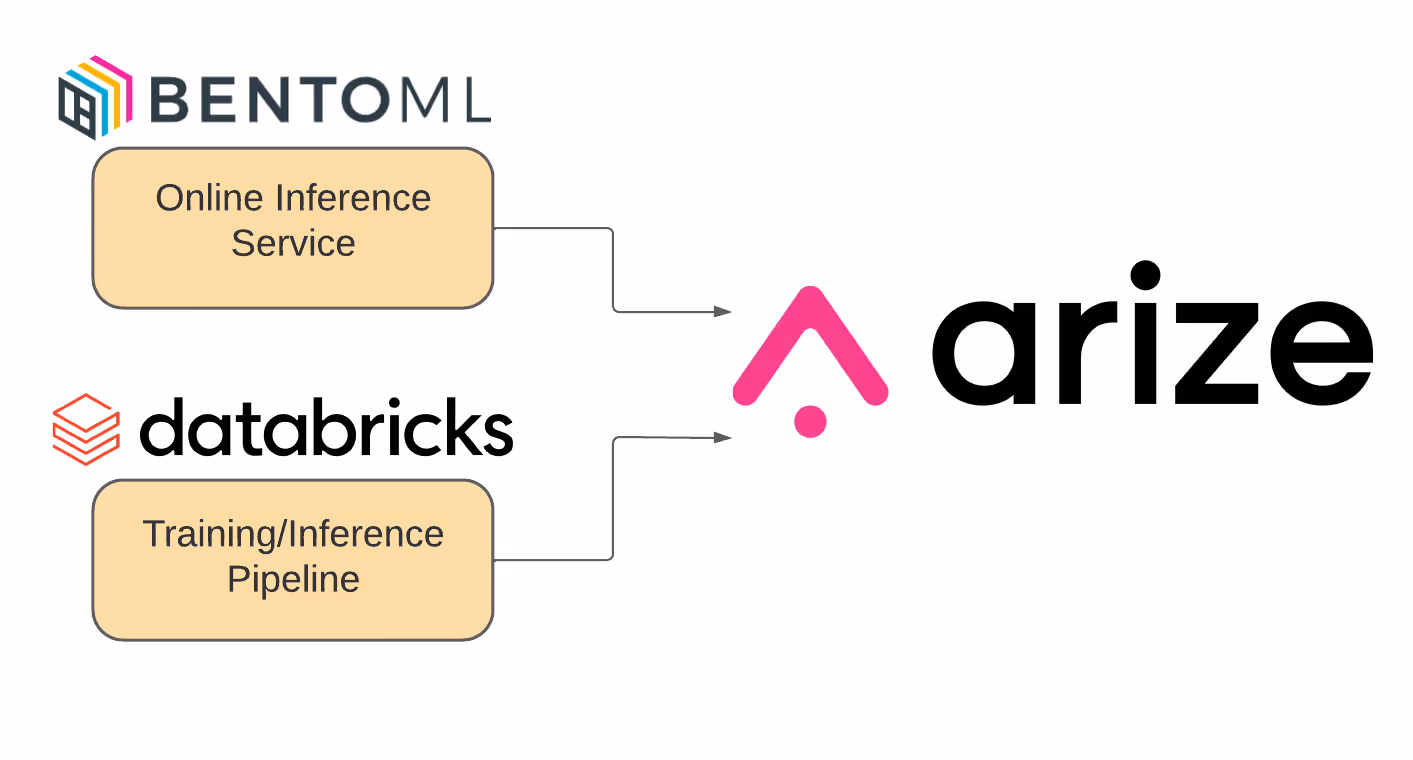
During the POC, we worked together with the Arize team to get onboarded to the platform. Over the next couple of months, we integrated Arize into a few of our ML models in order to better understand the capabilities of the platform and evaluate how well it fit our different use cases. Right from the get-go, we were satisfied with the unified API provided by Arize that could be used for both batch and real-time data ingestion. We found that integrating with the platform was straightforward as it allowed us to ingest features and predictions directly as pandas data frames from our existing batch pipelines and services. Additionally, the platform provided the convenience of managing alerts and monitoring model performance and feature drift, from a single location.
A clear benefit we saw with Arize was that the platform simplified the process of creating alerts and dashboards by automating it. This saves data scientists from having to spend a significant amount of time manually configuring these features and allows them to focus on other critical tasks. In a few cases though, we did find that the alert thresholds were occasionally overly sensitive. Fortunately, modifying and customizing these thresholds through the user interface was quite straightforward.
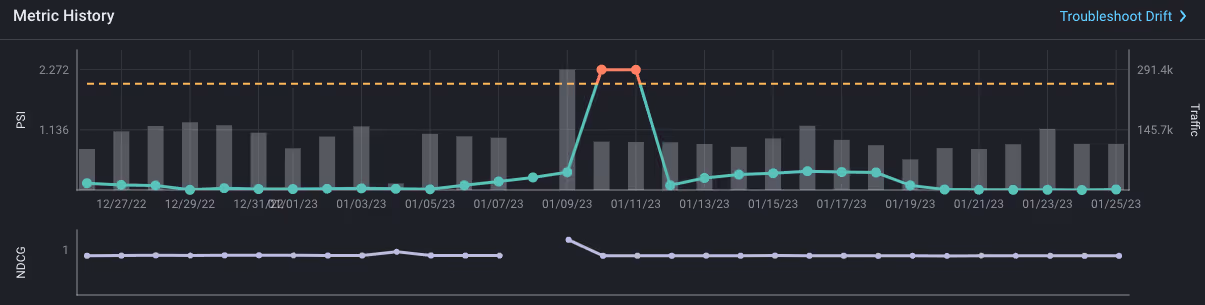
Finally, we found that the platform offered great exploratory analysis and model debugging capabilities, and during the POC it was able to reliably detect model issues. For instance, in one particular case we intentionally introduced a feature drift by slightly shifting the distribution of two model features, one numerical and one categorical. Arize was able to identify this feature drift by monitoring its PSI and cardinality with its automated monitors, and subsequently trigger an alert before any noticeable model performance drop was evident.
What’s Next?
In the end, based on our positive experience with Arize during the POC, we are confident that the platform will help us have more streamlined and effective ML observability practices across our teams. The platform has now been moved into the trial ring on our tech radar and over the course of the year, we will continue the process of integrating all our ML models into Arize and onboard all data scientists to the tool with demos and workshops. Finally, in the longer term we will also be evaluating the platform more widely based on how well it prevents large incidents, provides actionable insights about our models in production, and provides reliable alerts and monitors without too many false positives.
We believe that products like Arize are raising the bar for the industry in terms of ML observability. Standardized model observability will soon become a best practice and an integral part of any new machine learning projects in production, similar to what Datadog and Grafana have achieved in software engineering. We are excited to be part of this evolution of data science, as we continue working with Arize and leverage the platform’s capabilities.
Thank you to Jean Carlo Machado, Martin Jewell, Marina Zemskova and Mathieu Bastian for their contributions and advice during this work.

More articles like this